

Release Date :
Reference Number :
24R1280-PR-040
YEAR-ON-YEAR INFLATION RATES
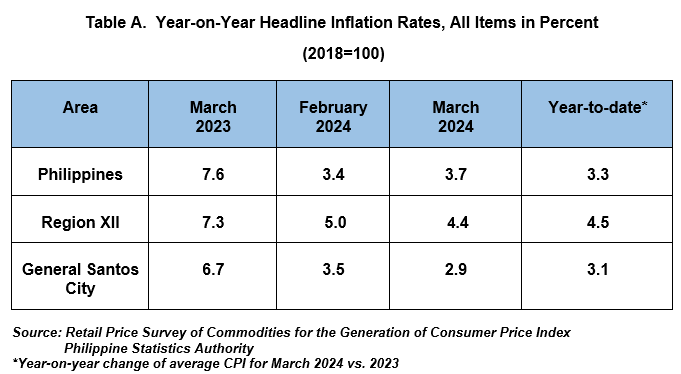
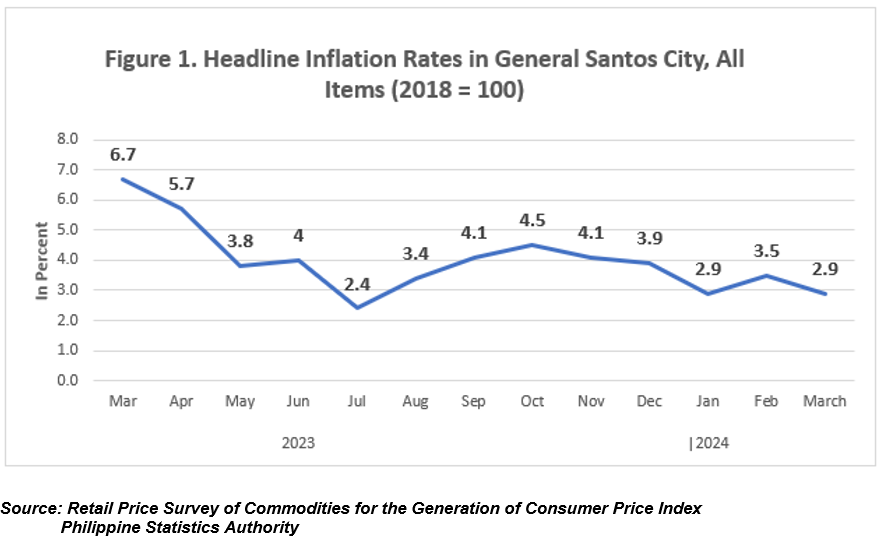
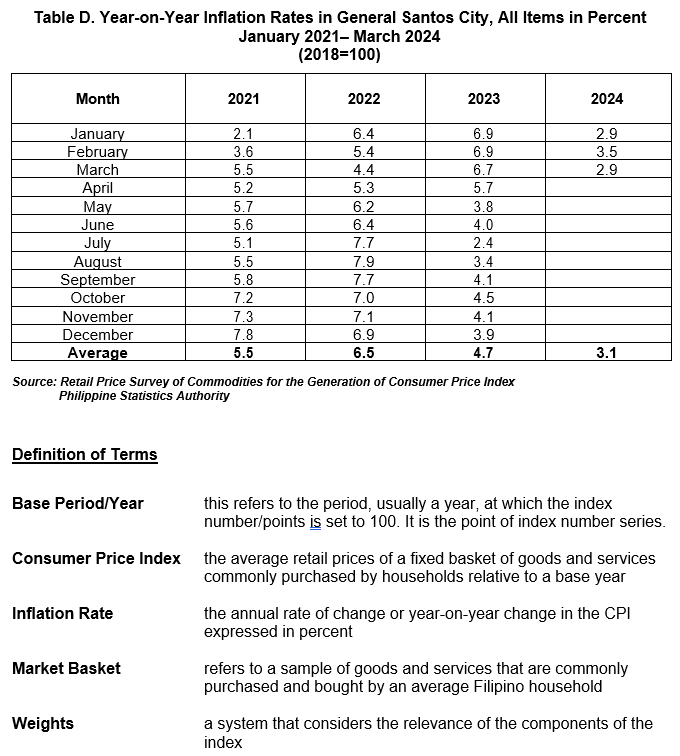
The headline inflation or the annual rate of change on the prices of goods and services in the market basket in General Santos City decreased to 2.9 percent in March 2024 from last month’s inflation at 3.5 percent. This was lower than the regional level at 4.4 percent and national level at 3.7 percent. This was also lower by 3.8 percentage points from a year ago of the same month at 6.7 percent. The average inflation or the year-to-date inflation of the city was recorded at 3.1 percent.
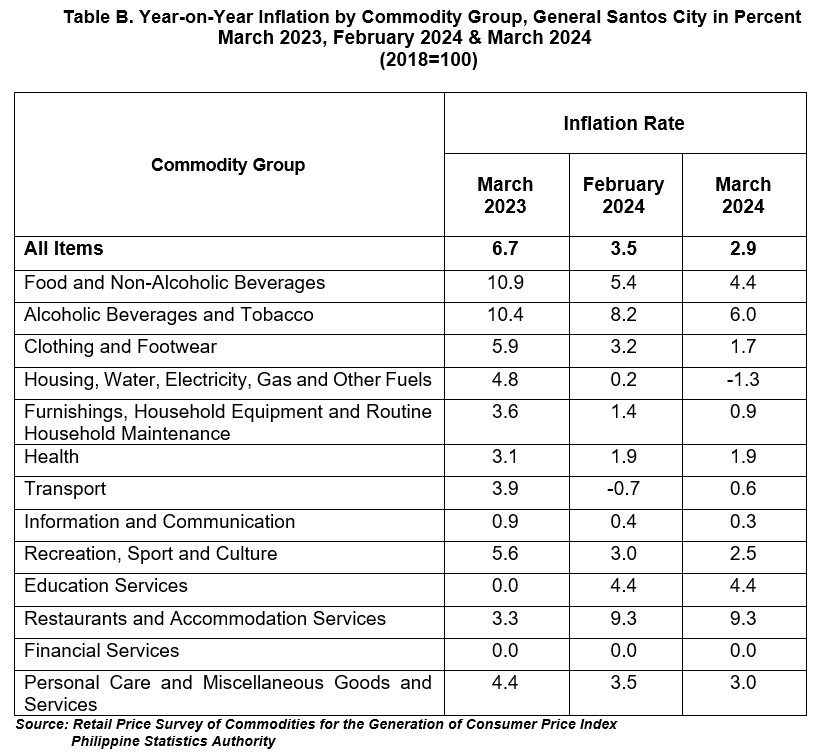
The main contributors to the city’s downtrend inflation for the month of March 2024 are as follows:
a) Food and Non-Alcoholic Beverages, from 5.4% to 4.4%;
b) Housing, Water, Electricity, Gas and Other Fuels, from 0.2% to -1.3%;
c) Clothing and Footwear, from 3.2% to 1.7%;
d) Alcoholic Beverages and Tobacco, from 8.2% to 6.0%;
e) Personal Care, and Miscellaneous Goods and Services, from 3.5% to 3.0%;
f) Furnishings, Household Equipment and Routine Household Maintenance,
from 1.4% to 0.9%;
g) Recreation, Sport, and Culture, from 3.0% to 2.5%; and
h) Information and Communication, from 0.4% to 0.3%.
Food and Non-Alcoholic Beverages contributed 47.3% to this downtrend; while Housing, Water, Electricity, Gas and Other Fuels at 34.6%, and Clothing and Footwear at 6.8%, respectively.
On the contrary, Transport group increases its inflation this March 2024, from -0.7% to 0.6%.
The rest of the commodity groups: Health, Education Services, Restaurants and Accommodation Services and Financial Services maintained their previous month’s inflation rates (Table B).
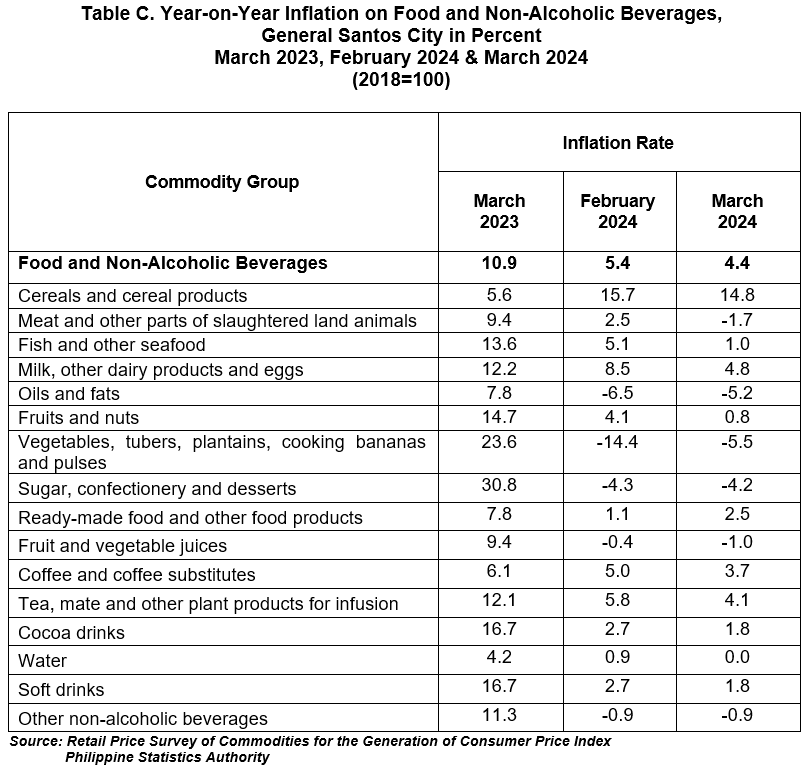
Food and Non-Alcoholic Beverages decreased from 5.4 percent in February 2024 to 4.4 percent in March 2024.
The commodity groups that contributed to the decrease in Food and Non-Alcoholic Beverages were Fish and other seafood at 1.0 percent from 5.1 percent; Meat and other parts of slaughtered land animals at -1.7 percent from 2.5 percent; Cereals and cereal products at 14.8 percent from 15.7 percent; Milk, other dairy products and eggs at 4.8 percent from 8.5 percent; Fruits and nuts at 0.8 percent from 4.1 percent; Coffee and coffee substitutes at 3.7 percent from 5.0 percent; Cocoa drinks at 1.8 percent from 2.7 percent; Soft drinks at 1.8 percent from 2.7 percent; Water at 0.0 percent from 0.9 percent; Fruit and vegetable juices at -1.0 percent from -0.4 percent; and Tea, mate and other plant products for infusion at 4.1 percent from 5.8 percent.
Please see Table C for the year-on-year inflation on Food and Non-Alcoholic Beverages group in percent.
Approved for Release:
SGD
ISMAEL B. RAMOS JR.
Chief Statistical Specialist
For inquiries, please contact:
SGD
MARIFI P. DE ASIS
Supervising Statistical Specialist
Telephone Number (083) 552-2502
| Attachment | Size |
|---|---|
|
|
598.39 KB |