

Release Date :
Reference Number :
24R1280-PR-104
YEAR-ON-YEAR INFLATION RATES
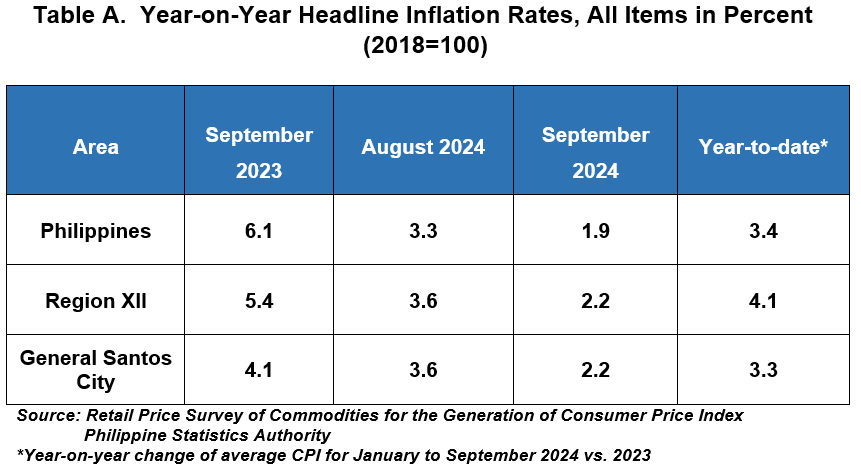
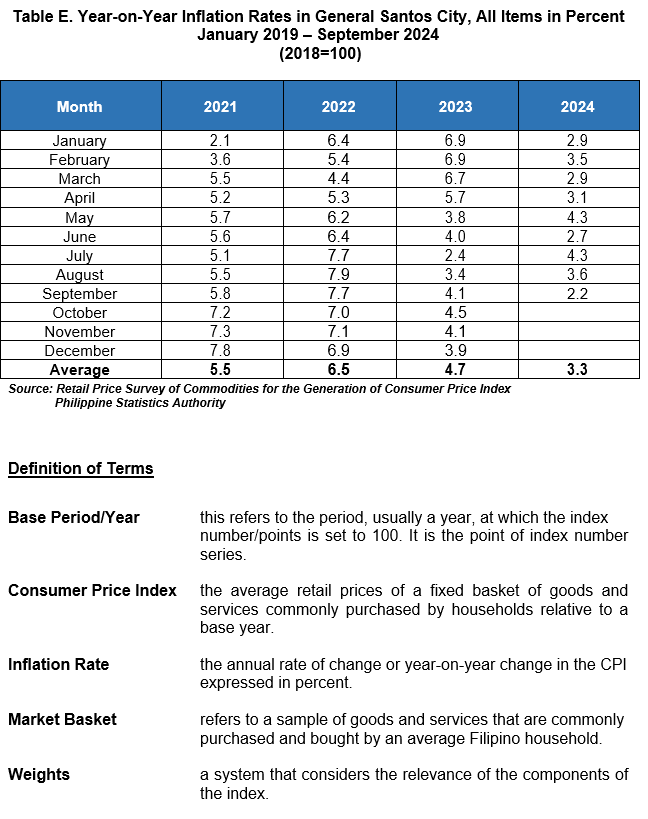
The headline inflation or the annual rate of change in the prices of goods and services in the market basket in General Santos City slowed down to 2.2 percent in September 2024 from 3.6 percent in August 2024. This was higher than the national level at 1.9 percent and equal to the regional level at 2.2 percent. In September 2023, the inflation rate was higher at 4.1 percent. The city level average inflation from January to September 2024 stood at 3.3 percent. (Table A and Figure 1).

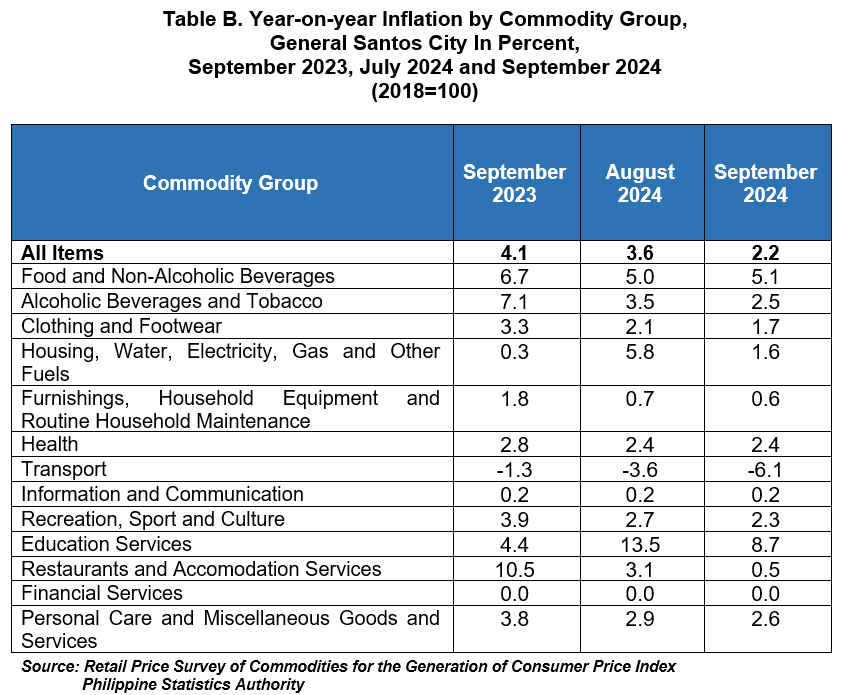
The downtrend in the city’s inflation rate in September 2024 was mainly driven by the lower annual increment of housing, water, electricity, gas and other fuels at 1.6 percent from 5.8 percent inflation in August 2024. This was followed by transport at -6.1 percent in September 2024 from -3.6 percent in August 2024. The index of restaurants and accommodation services also contributed to the downtrend with an inflation rate of 0.5 percent during the month from 3.1 percent in August 2024. Also, the following commodity groups registered lower annual growth rates during the month:
a. Alcoholic beverages and tobacco, 2.5 percent from 3.5 percent;
b. Clothing and footwear, 1.7 percent from 2.1 percent;
c. Furnishings, household equipment and routine household maintenance, 0.6 percent from 0.7 percent;
d. Recreation, sport and culture, 2.3 percent from 2.7 percent;
e. Education Services, 8.7 percent from 13.5 percent; and
f. Personal care and miscellaneous goods and services, 2.6 percent from 2.9 percent. (Table B)
On the contrary, the food and non-alcoholic beverages registered higher annual growth rate during the month at 5.1 percent from 5.0 percent in August 2024. (Table B)
The following are the commodity groups that retained their previous month’s annual rates:
a. Health, at 2.4 percent;
b. Information and communication, at 0.2 percent; and
c. Financial services, at 0.0 percent. (Table B)
The decreased inflation for housing, water, electricity, gas, and other fuels was primarily due to the slower annual growth in the electricity index at 5.0 percent in September 2024 from 16.0 percent in August 2024. The index of actual rentals paid by tenants for main residence also contributed to the downtrend with 0.0 percent during the month from 2.4 percent in August 2024. A lower annual increment was also observed in gas at 8.9 percent in September 2024 from 15.9 percent in the previous month. (Table C)

Food inflation at the city level increased to 5.2 percent in September 2024 from 5.1 percent in August 2024. In September 2023, food inflation was higher at 6.7 percent. (Table D)
The acceleration of food inflation in September 2024 was due to higher annual increase of fish and other seafood index with 9.4 percent from 4.8 percent in August 2024. Also, fruits and nuts increased from 2.6 percent in August 2024 to 14.8 percent in September 2024. The index of milk, other dairy products and eggs also contributed to the uptrend with 5.6 percent during the month from 4.8 percent in August 2024. (Table D)
Higher annual increments were also noted in the indices of the following food groups during the month:
a. Meat and other parts of slaughtered land animals, 5.8 percent from 5.7 percent;
b. Oils and fats, -0.3 percent from -0.4 percent; and
c. Sugar, confectionery and desserts, -6.9 percent from -7.4 percent. (Table D)
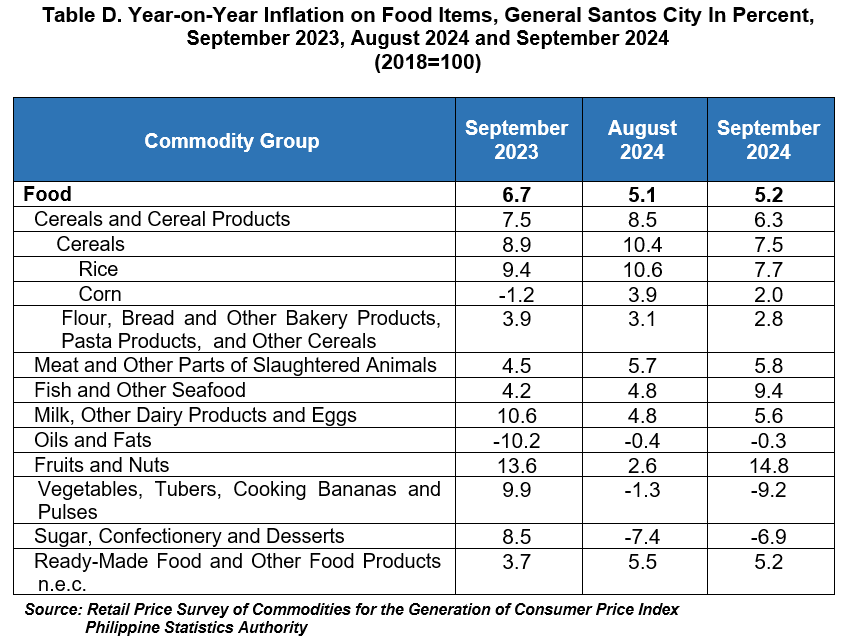
In contrast, slower annual increments were also noted in the indices of the following food groups during the month:
a. Cereals and cereal products, 6.3 percent from 8.5 percent;
b. Vegetables, tubers, plantains, cooking bananas and pulses, -9.2 percent from -1.3 percent; and
c. Ready-made food and other food products n.e.c., 5.2 percent from 5.5 percent. (Table D)

| Attachment | Size |
|---|---|
|
|
316.82 KB |