

Release Date :
Reference Number :
24R1280-PR-030
YEAR-ON-YEAR INFLATION RATES
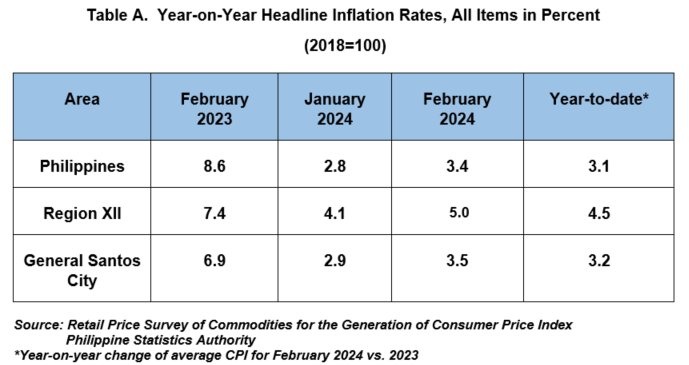
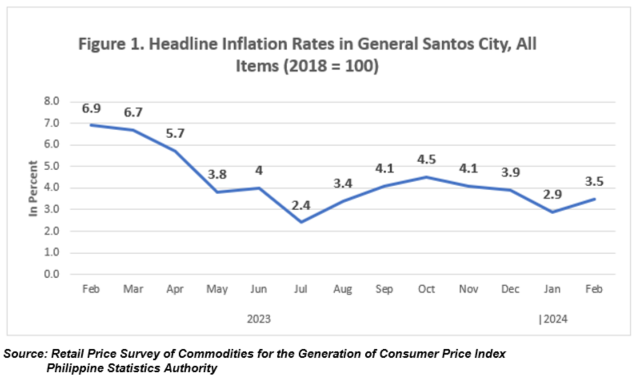
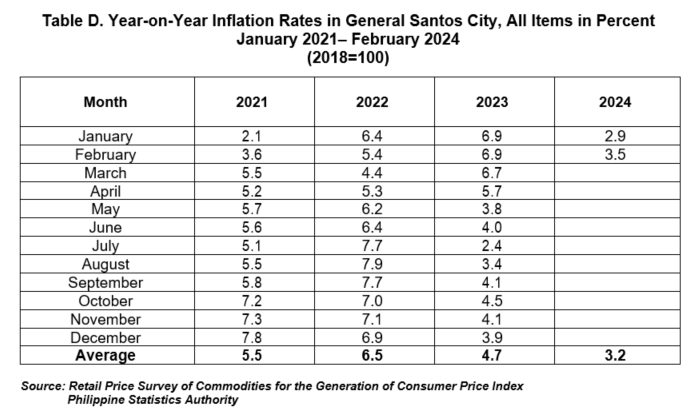
The headline inflation or the annual rate of change on the prices of goods and services in the market basket in General Santos City increased to 3.5 percent in February 2024 from last month’s inflation at 2.9 percent. This was lower than the regional level at 5.0 percent and higher than the national level at 3.4 percent. This was also lower by 3.4 percentage points from a year ago of the same month at 6.9 percent. The average inflation or the year-to-date inflation of the city was recorded at 3.2 percent.
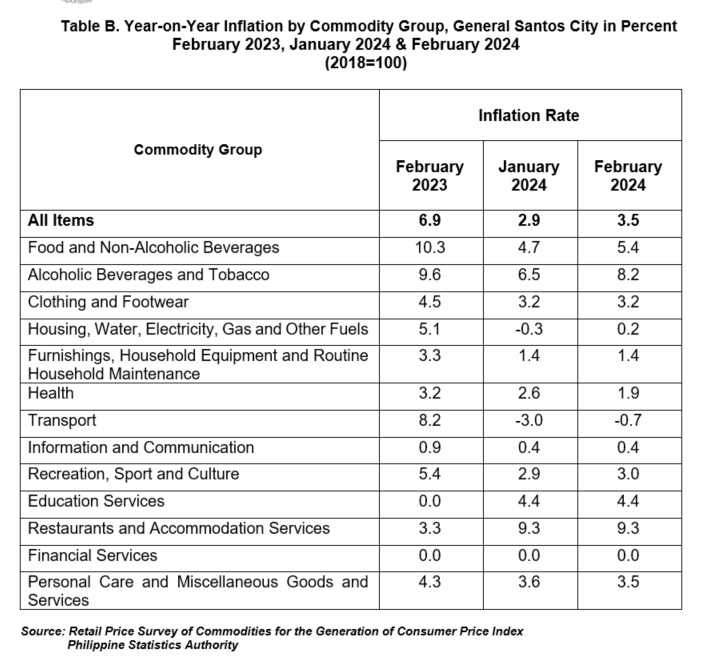
The main contributors to the city’s uptrend inflation for the month of February 2024 are as follows:
a) Food and Non-Alcoholic Beverages, from 4.7% to 5.4%;
b) Transport, from -3.0% to -0.7%;
c) Housing, Water, Electricity, Gas and Other Fuels, from -0.3% to 0.2%;
d) Alcoholic Beverages and Tobacco, from 6.5% to 8.2%;
e) Recreation, sport, and culture, from 2.9% to 3.0%
Food and Non-Alcoholic Beverages contributed 42.4% to this uptrend, while Transport at 36.9%, and Housing, Water, Electricity, Gas and Other Fuels at 14.8%, respectively.
On the contrary, Health and Personal Care, and Miscellaneous Goods and Services groups decrease its inflation this February 2024, from 2.6% to 1.9%, respectively.
The rest of the commodity groups: Clothing and Footwear, Furnishings, Household Equipment and Routine Household Maintenance, Information and Communication, Education Services, Restaurants and Accommodation Services and Financial Services maintained their previous month’s inflation rates (Table B).
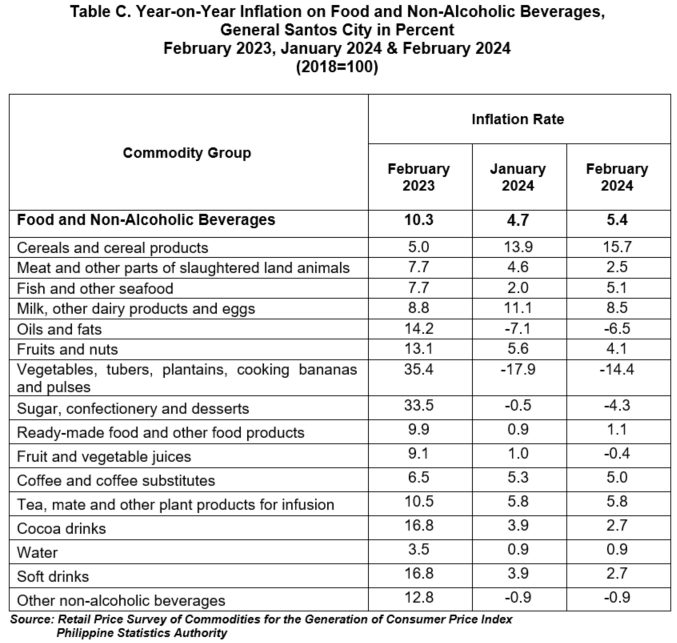
Food and Non-Alcoholic Beverages increased from 4.7 percent in January 2024 to 5.4 percent in February 2024.
The commodity groups that contributed to the increase in Food and Non-Alcoholic Beverages were Cereals and Cereal Products at 15.7 percent from 13.9 percent; Fish and other seafood at 5.1 percent from 2.0 percent, Vegetables, tubers, plantains, cooking bananas and pulses at -14.4 percent from -17.9 percent; Oils and fats at -6.5 percent from -7.1 percent and Ready-made food and other food products at 1.1 percent from 0.9 percent.
Please see Table C for the year-on-year inflation on Food and Non-Alcoholic Beverages group in percent.
Definition of Terms
Base Period/Year this refers to the period, usually a year, at which the index number/points is set to 100. It is the point of index number series.
Consumer Price Index the average retail prices of a fixed basket of goods and services commonly purchased by households relative to a base year
Inflation Rate the annual rate of change or year-on-year change in the CPI expressed in percent
Market Basket refers to a sample of goods and services that are commonly purchased and bought by an average Filipino household
Weights a system that considers the relevance of the components of the index
Approved for Release:
(SGD)ISMAEL B. RAMOS, JR.
Chief Statistical Specialist
For inquiries, please contact:
(SGD)MARIFI P. DE ASIS
Supervising Statistical Specialist
Telephone Number (083) 552-2502