

Release Date :
Reference Number :
24R1280-PR-054
YEAR-ON-YEAR INFLATION RATES
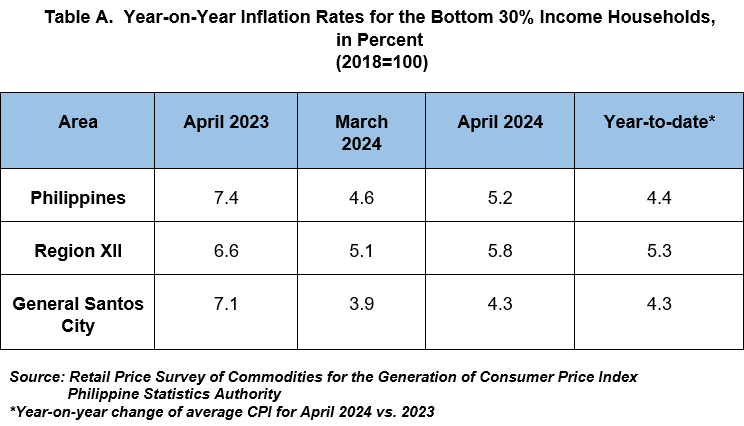
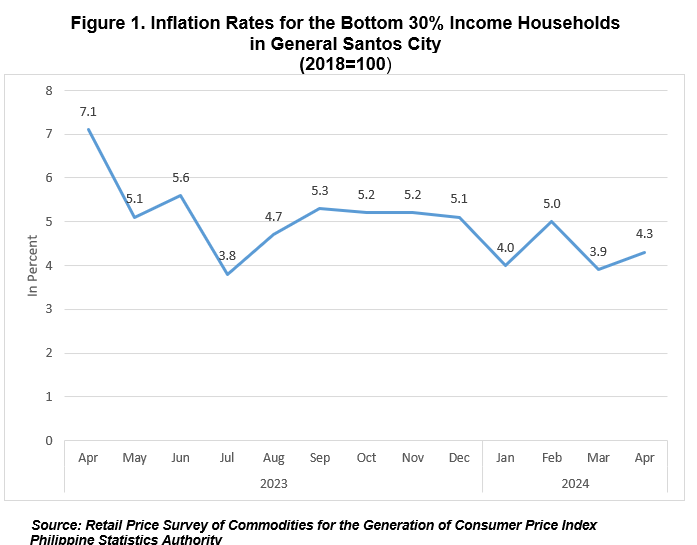
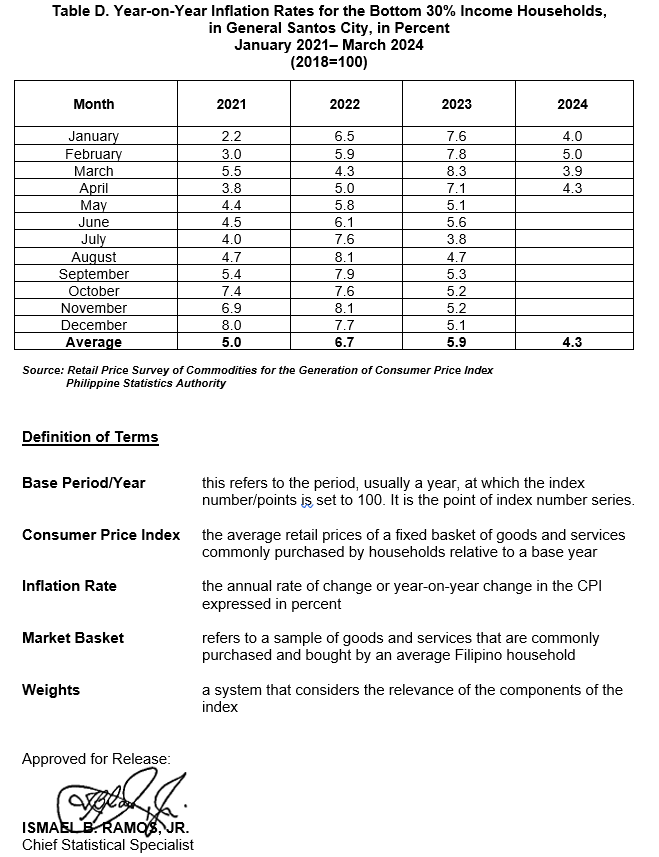
The inflation or the annual rate of change on the prices of goods and services in the market basket for the bottom 30% income households or the low income group in General Santos City increased to 4.3 percent in April 2024 from last month’s inflation at 3.9 percent. This was lower than the regional and national levels at 5.8 percent and 5.2 percent, respectively. This was also lower by 2.8 percentage points from a year ago of the same month at 7.1 percent. The average inflation or the year-to-date inflation of the city was recorded at 4.3 percent.
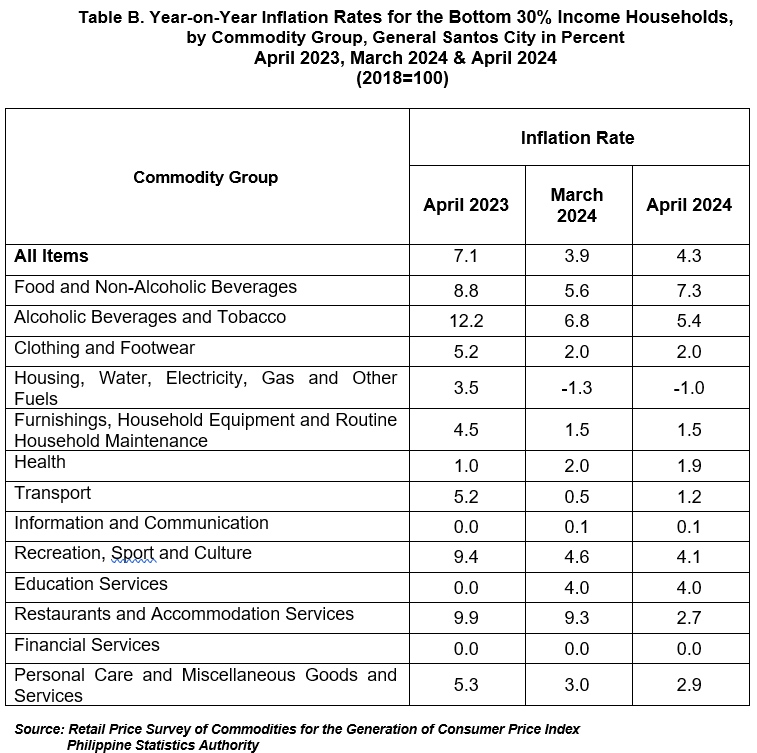
The main contributors to the city’s uptrend inflation for the bottom 30% income households for the month of April 2024 are as follows:
a) Food and Non-Alcoholic Beverages, from 5.6% to 7.3%;
b) Transport, from 0.5% to 1.2%; and
c) Housing, Water, Electricity, Gas and Other Fuels, from -1.3% to -1.0%;
Food and Non-Alcoholic Beverages contributed 88.5% to this uptrend, while Transport at 6.6%, and Housing, Water, Electricity, Gas and Other Fuels at 4.9%.
Meanwhile, the following commodity groups showed a downward trend for the bottom 30% income households for the month of April 2024:
a) Restaurants and Accommodation Services, from 9.3% to 2.7%;
b) Alcoholic Beverages and Tobacco, 6.8% to 5.4%;
c) Health, from 2.0% to 1.9%;
d) Recreation, Sport and Culture, from 4.6% to 4.1; and
e) Personal Care and Miscellaneous Goods and Services, from 3.0% to 2.9%
The rest of the commodity groups: Clothing and Footwear; Furnishing, Household Equipment and Routine Household; Information and Communication; Education Services and Financial Services maintained their previous month’s inflation rates (Table B).
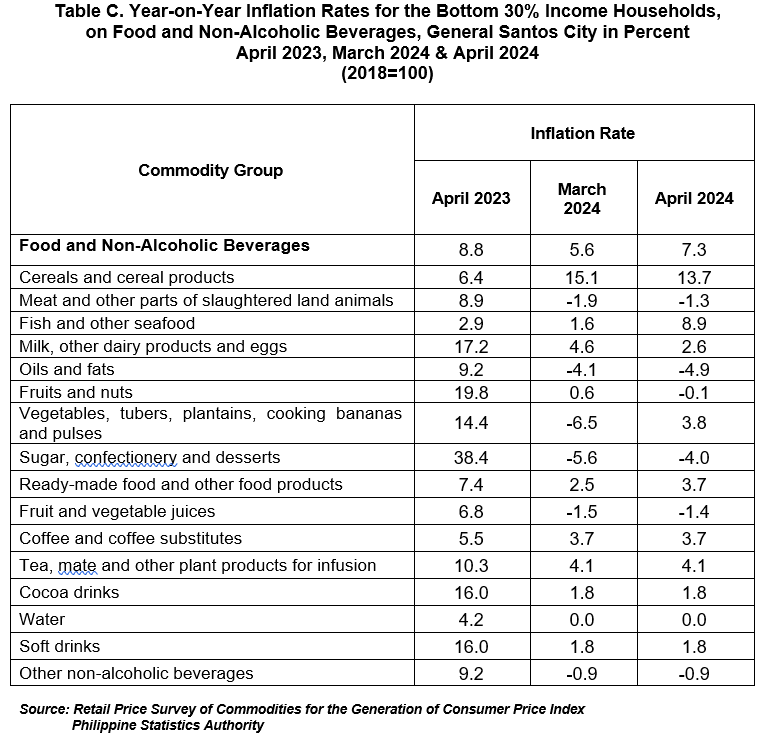
Food and Non-Alcoholic Beverages increased from 5.6 percent in March 2024 to 7.3 percent in April 2024.
The commodity groups that contributed to the increase in Food and Non-Alcoholic Beverages were: Fish and other seafood at 8.9 percent from 1.6 percent; Vegetables, tubers, plantains, cooking bananas and pulses at 3.8 percent from -6.5 percent; Meat and other parts of slaughtered land animals at -1.3 percent from -1.9 percent; Ready-made food and other food products at 3.7 percent from 2.5 percent; Sugar, confectionery and desserts at -4.0 percent from -5.6 percent and Fruit and vegetable juices at -1.4 percent from -1.5 percent.
Please see Table C for the year-on-year inflation on Food and Non-Alcoholic Beverages group in percent.
| Attachment | Size |
|---|---|
|
|
392.17 KB |