

Release Date :
Reference Number :
24R1280-PR-061
YEAR-ON-YEAR INFLATION RATES
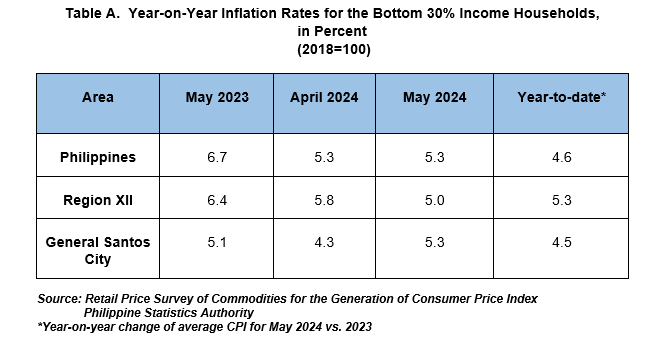
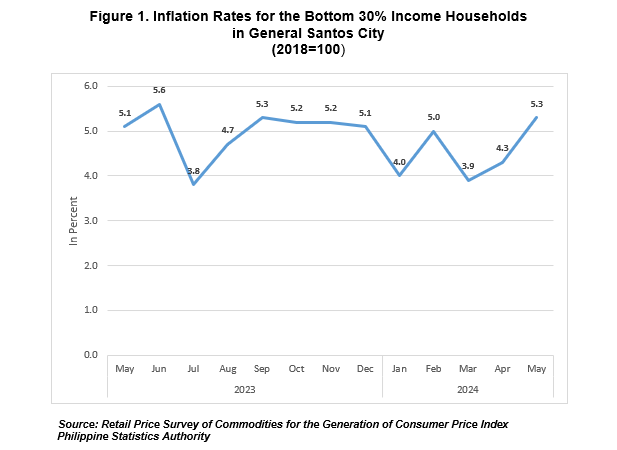
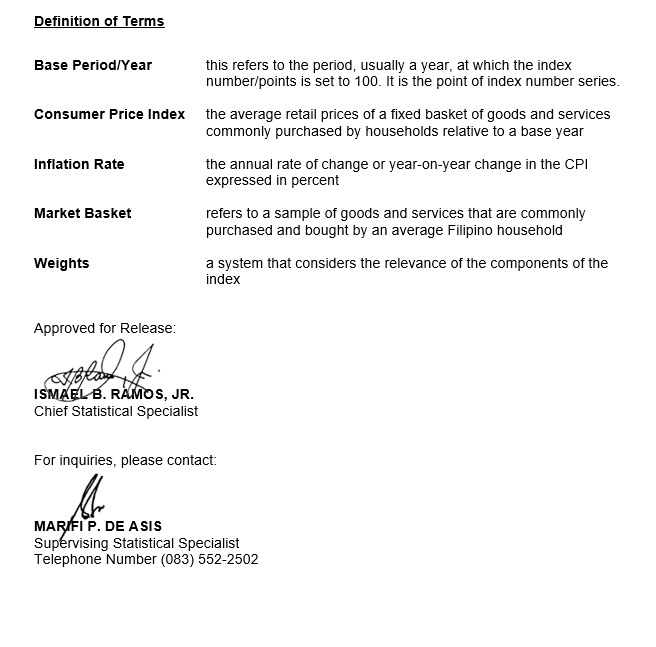
The inflation or the annual rate of change on the prices of goods and services in the market basket for the bottom 30% income households or the low income group in General Santos City increased to 5.3 percent in May 2024 from last month’s inflation at 4.3 percent. This was higher than the regional level at 5.0 percent and equal to national level at 5.3 percent. This was slightly higher by 0.2 percentage points from a year ago of the same month at 5.1 percent. The average inflation or the year-to-date inflation of the city was recorded at 4.5 percent.
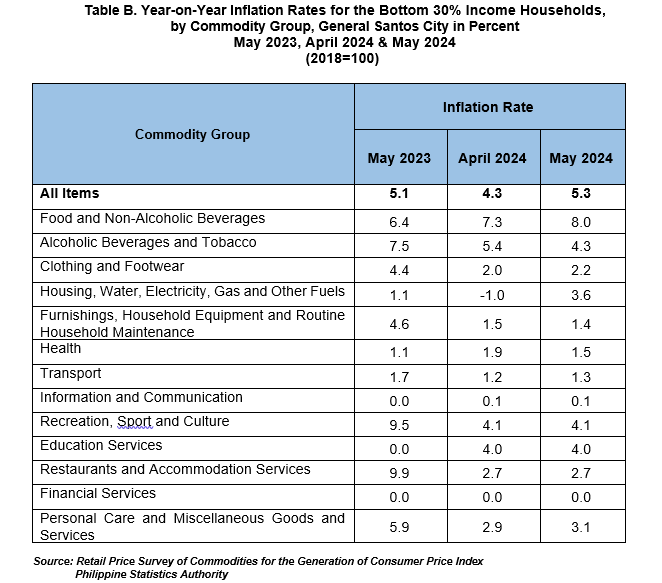
The main contributors to the city’s uptrend inflation for the bottom 30% income households for the month of May 2024 are as follows:
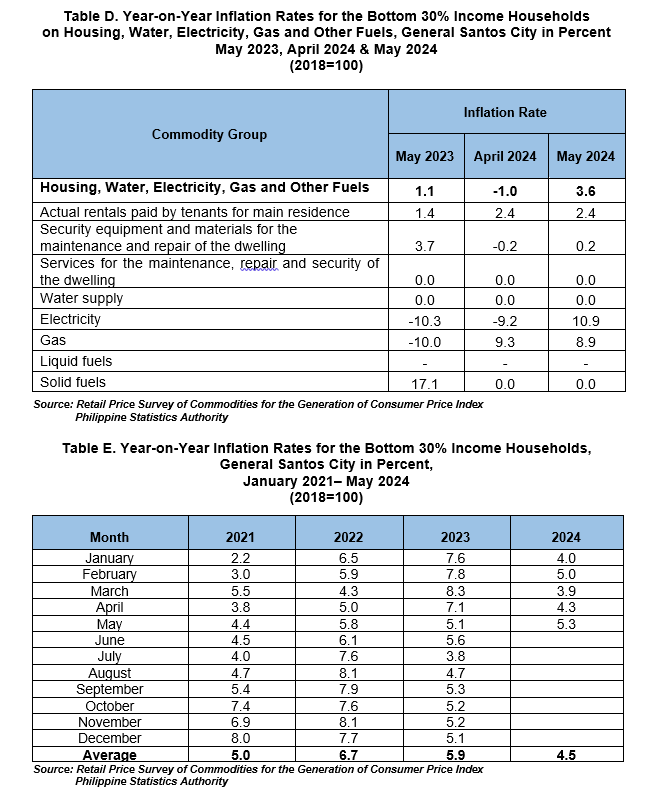
a) Housing, water, electricity, gas and other fuels, 3.6% from -1.0%;
b) Food and non-alcoholic beverages, 8.0% from 7.3%;
c) Transport, 1.3% from 1.2%;
d) Personal care and miscellaneous goods and services, 3.1% from 2.9%; and
e) Clothing and footwear, 2.2% from 2.0%.
Housing, water, electricity, gas and other fuels contributed 65.9% to this uptrend, while food and non-alcoholic beverages at 32.0% and transport at 0.8%.
Meanwhile, the following commodity groups showed a downward trend for the bottom 30% income households for the month of May 2024:
a) Alcoholic beverages and tobacco, 4.3% from 5.4%;
b) Furnishing, household equipment and routine household, 1.4% from 1.5%; and
c) Health, 1.5% from 1.9%.
The rest of the commodity groups: Information and communication; recreation, sport and culture; education services; restaurants and accommodation services and financial services maintained their previous month’s inflation rates. (Table B)
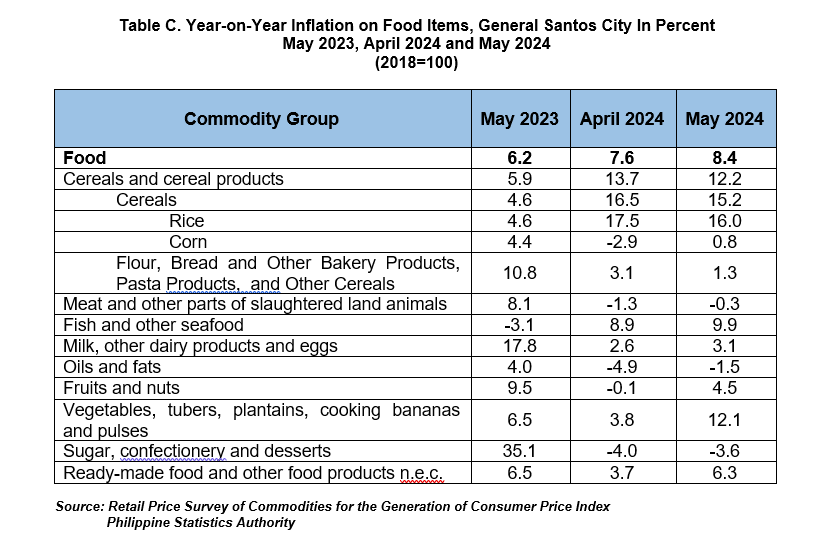
General Santos City’s food inflation for the bottom 30% households inclined to 8.4 percent in May 2024 from 7.6 percent in April 2024. In May 2023, food inflation for the bottom 30% households was lower at 6.2 percent. (Table 3)
The acceleration of food inflation for the bottom 30% households in May 2024 was due to the increase in vegetables, tubers, plantains, cooking bananas and pulses index at 12.1 percent in May 2024 from 3.8 percent in April 2024. This was followed by fish and other seafoods at 9.9 percent in May 2024 from 8.9 percent in the previous month. Fruits and nuts also contributed to the uptrend with 4.5 percent inflation rate in May 2024 from -0.1 percent in April 2024. Higher annual increments was also noted in ready-made food and other food products n.e.c.at 6.3 percent during the month from 3.7 percent in April 2024.
Moreover, slightly increased was also observed in meat and other parts of slaughtered land animals at -0.3% from -1.3%, oil and fats at -1.5% from -4.9%, milk, other dairy products and eggs at 3.1% from 2.6% and sugar, confectionery and desserts at -3.6% from 4.0%. (Table C)
In contrast, lower annual growth rates during the month were recorded in cereal and cereal products at 12.2 percent during the month from 13.7 percent in the previous month. (Table C)
The inflation for housing, water, electricity, gas and other fuels continued to increase at 3.6 percent in May 2024 from -1.0 percent in April 2024. This was mainly brought about by the higher year-on-year increase in electricity at 10.9 percent in May 2024 from -9.2 percent in the previous month. This was followed by security equipment and materials for the maintenance and repair of the dwelling at 0.2 percent during the month from -0.2 percent in April 2024.
| Attachment | Size |
|---|---|
|
|
298.93 KB |