

Release Date :
Reference Number :
25R1280-SR-040
Date of Release: 14 July 2025
Reference No. 25R1280-SR-040
A. Sarangani Province
1. Overall Inflation
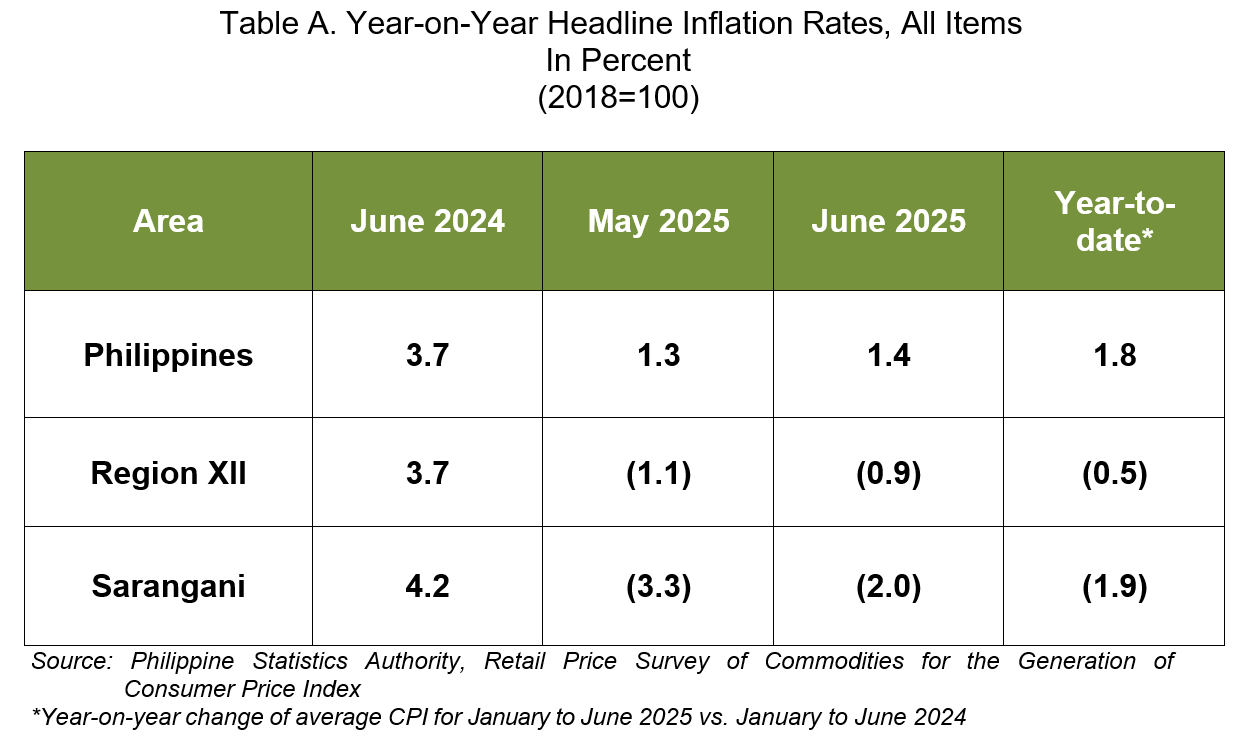
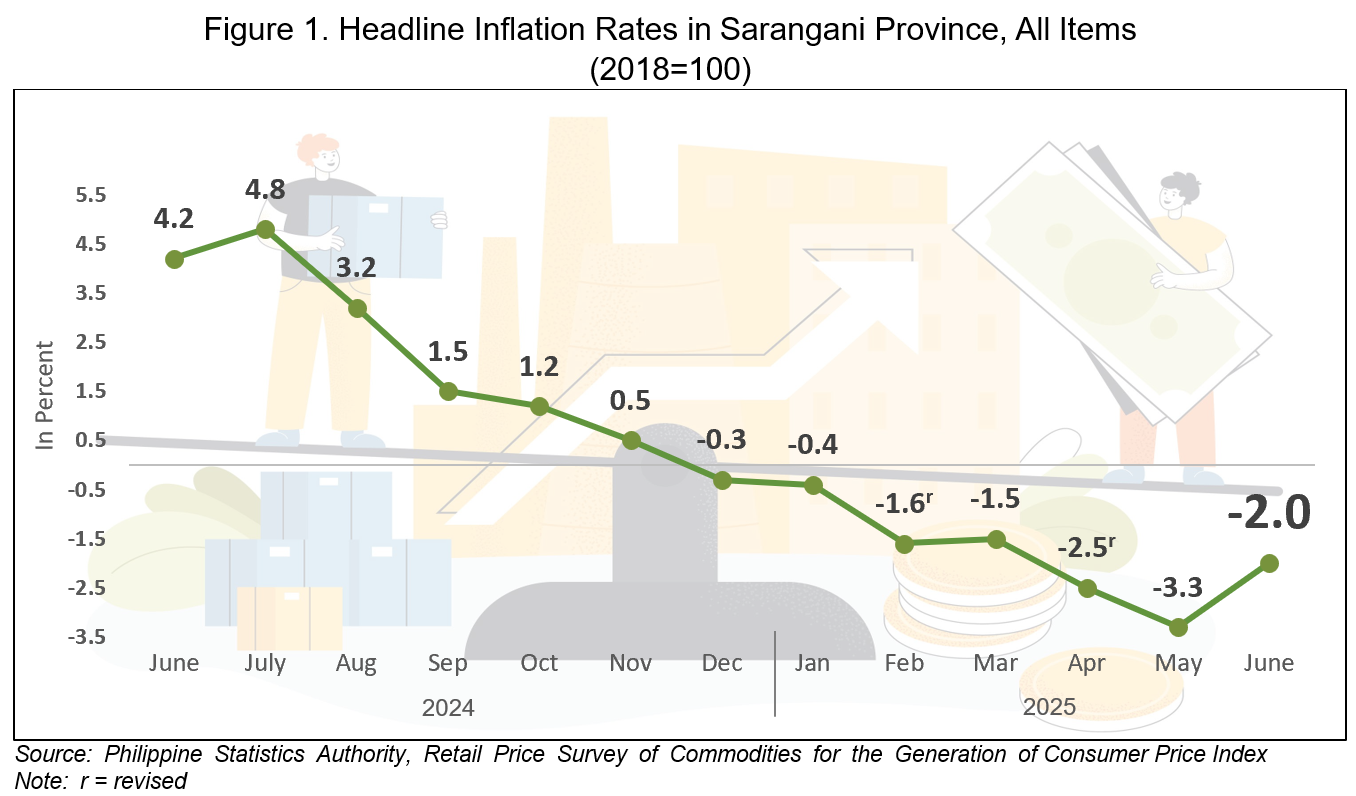
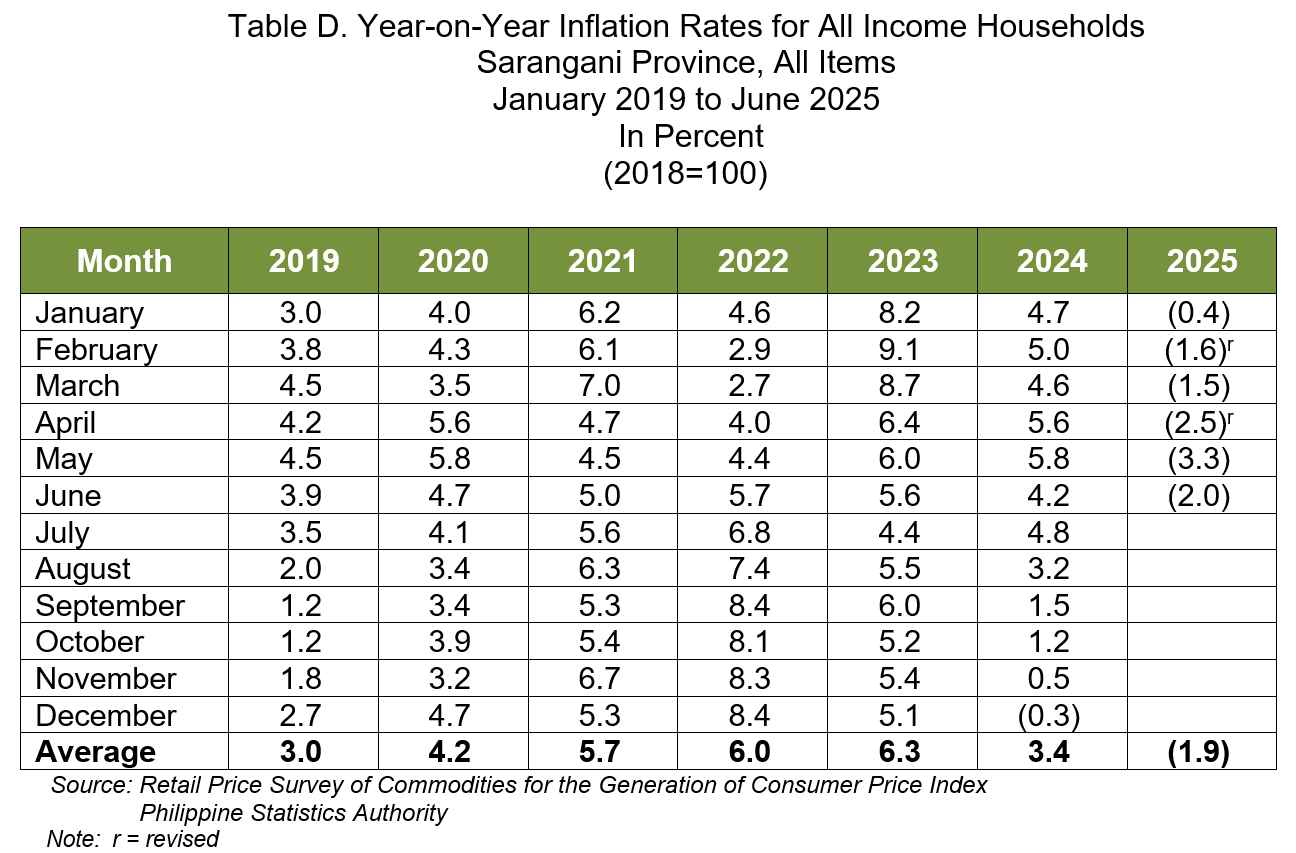
The headline inflation in Sarangani Province recorded a slower decline at 2.0 percent in June 2025 from a 3.3 percent annual drop in May 2025. In June 2024, the inflation rate was higher at 4.2 percent. (Table A and Figure 1)
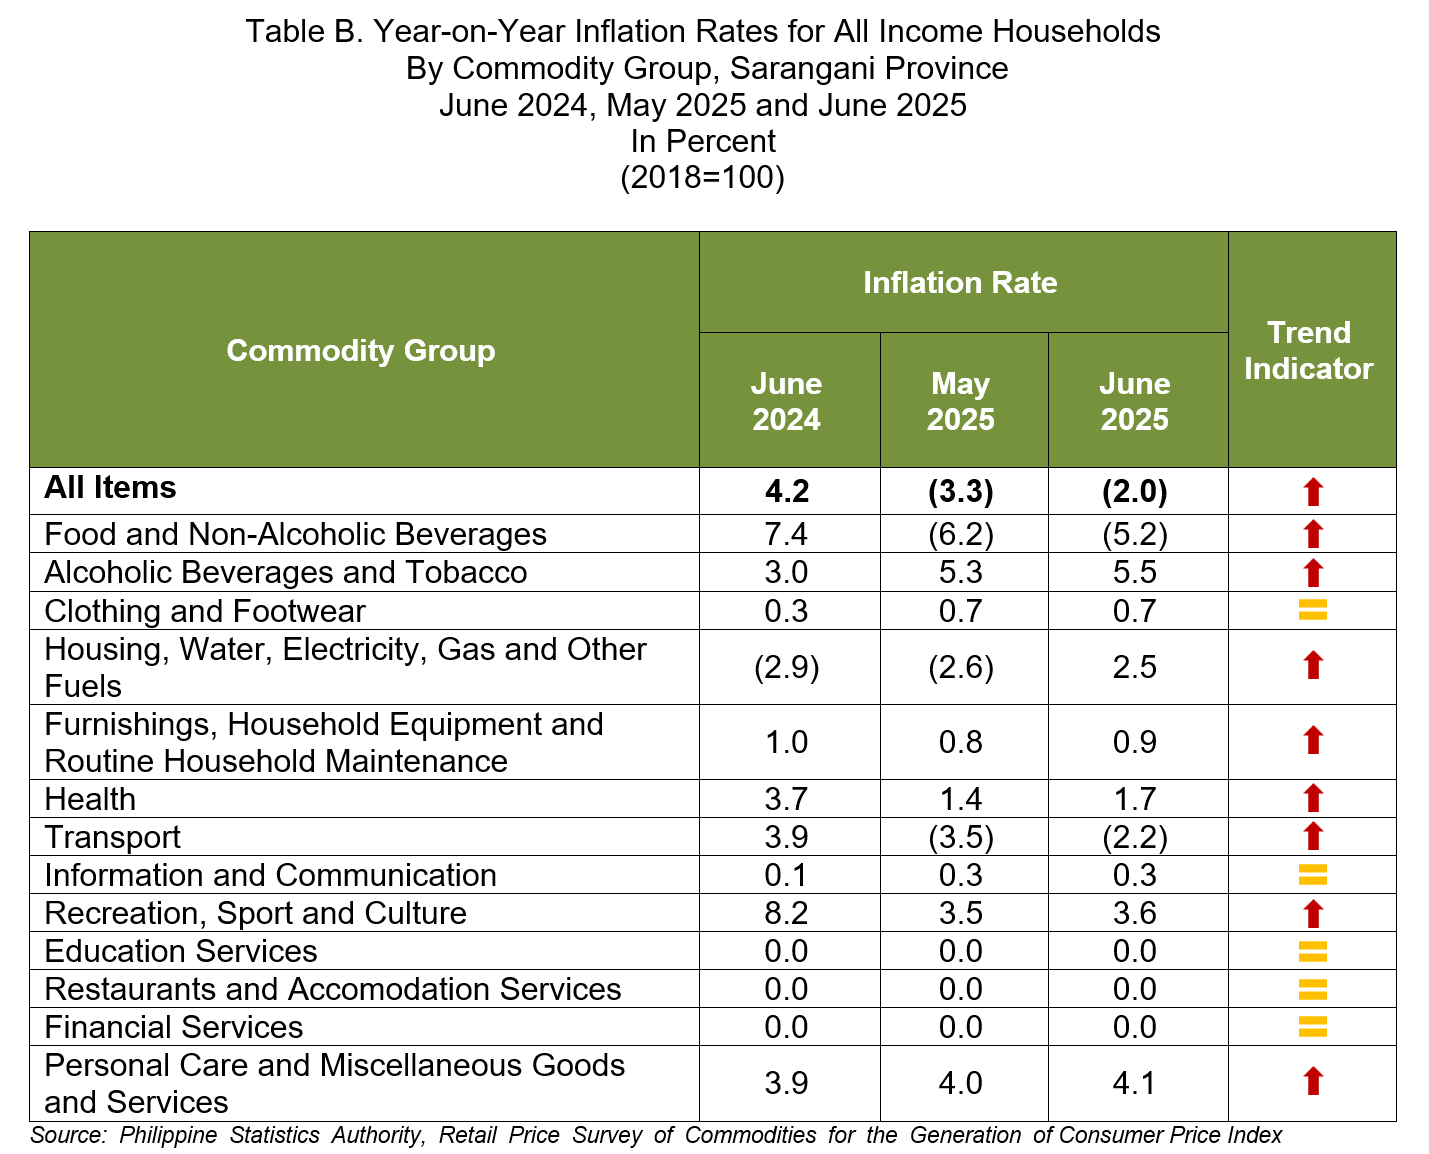
1.1 Main Drivers to the Upward Trend of the Overall Inflation (Table B)
The uptrend in the province’s inflation rate was primarily brought about by the annual increase in the index of housing, water, electricity, gas and other fuels at 2.5 percent in June 2025 from a 2.6 percent annual drop in the previous month. Slower annual decrements were observed in the indices of food and non-alcoholic beverages at 5.2 percent and transport at 2.2 percent during the month from their respective year-on-year decreases at 6.2 percent and 3.5 percent in May 2025.
Furthermore, higher inflation rates were noted in the following indices during the month:
a. Alcoholic beverage and tobacco, 5.5 percent from 5.3 percent;
b. Furnishings, household equipment and routine household maintenance, 0.9 percent from 0.8 percent;
c. Health, 1.7 percent from 1.4 percent;
d. Recreation, sport and culture, 3.6 percent from 3.5 percent; and
e. Personal care, and miscellaneous goods and services, 4.1 percent from 4.0 percent.
The indices of the following commodity groups retained their respective previous month’s inflation rates:
a. Clothing and footwear at 0.7 percent;
b. Information and communication at 0.3 percent;
c. Education services at zero inflation;
d. Restaurants and accommodation services at zero inflation; and
e. Financial services at zero inflation.
1.2 Main Contributors to the Headline Inflation
The top two commodity groups that contributed to the June 2025 overall inflation were the following:
a. Food and non-alcoholic beverages with 135.9 percent share or -2.7 percentage point; and
b. Transport with 10.6 percent share or -0.2 percentage point.
2. Food Inflation
Food inflation at the provincial level posted a slower year-on-year decline at 5.9 percent in June 2025 from an annual drop at 6.8 percent in May 2025. In June 2024, food inflation was higher at 7.7 percent.
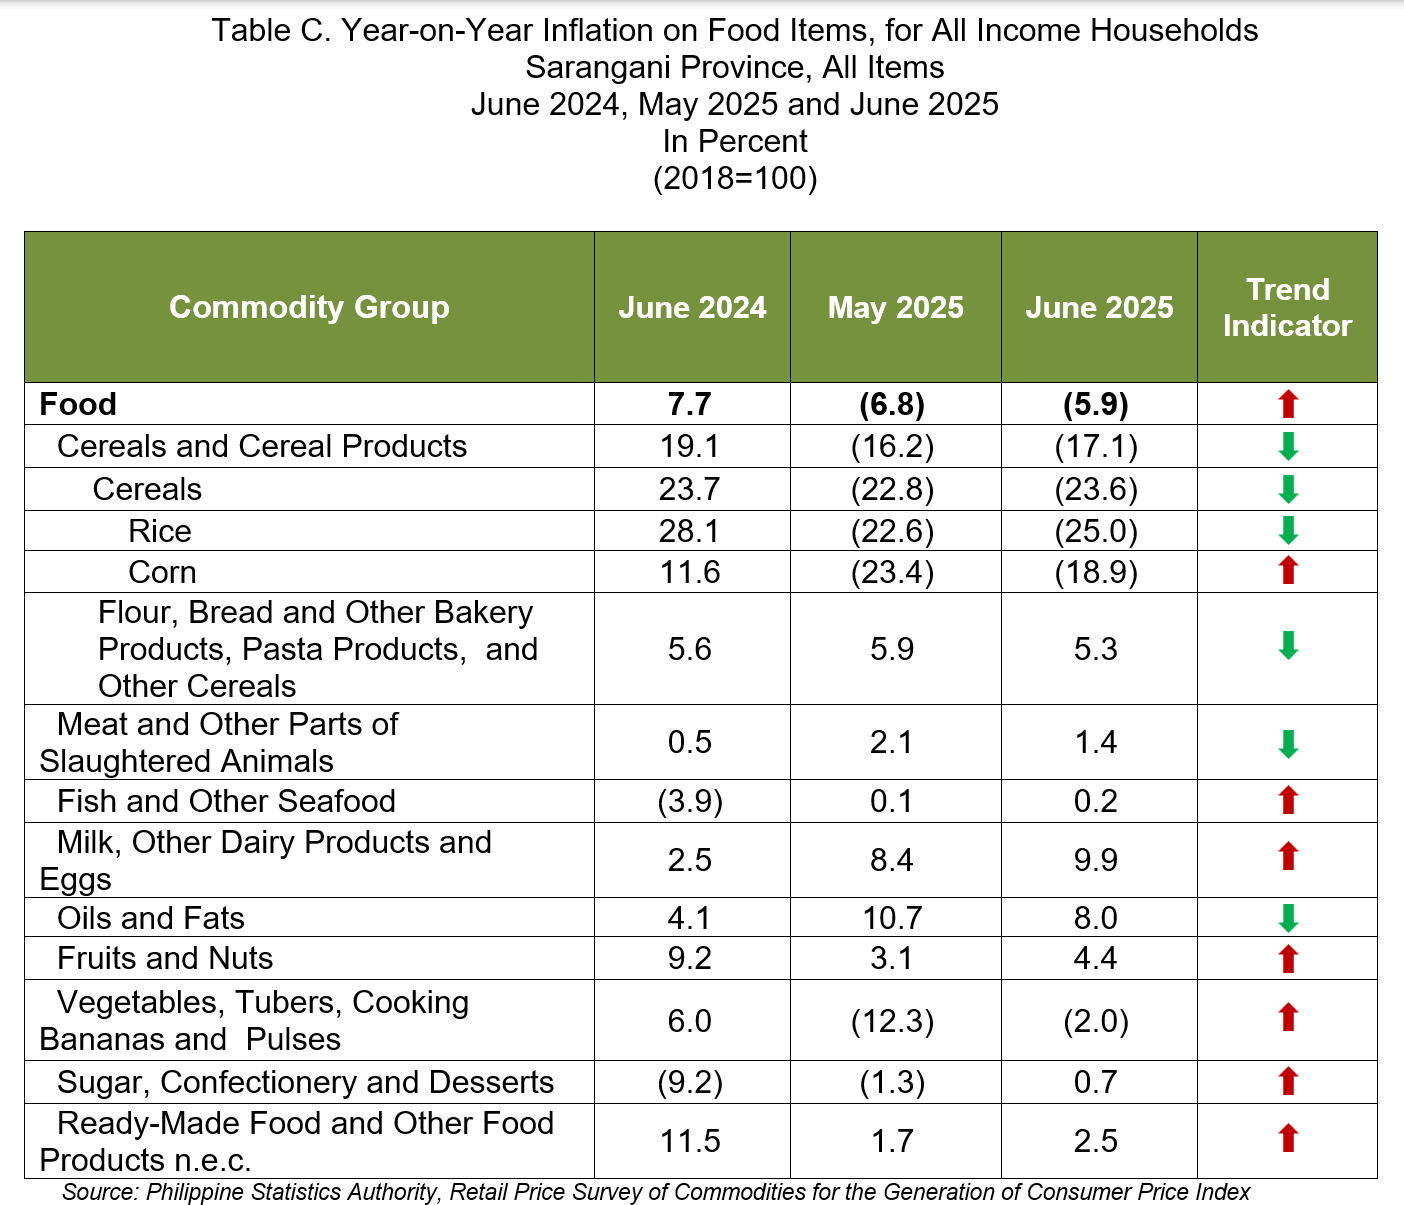
2.1 Main Drivers to the Upward Trend of the Food Inflation (Table C)
The uptrend in food inflation was primarily brought about by the slower annual decline of vegetables, tubers, plantains, cooking bananas and pulses at 2.0 percent in June 2025 from an annual decrease at 12.3 percent in May 2025. This was followed by the faster annual increment in the index of milk, other dairy products and eggs at 9.9 percent in June 2025 from 8.4 percent in the previous month. Sugar, confectionery and desserts also contributed to the uptrend with an annual increment at 0.7 percent during the month from a 1.3 percent annual drop in May 2025.
Moreover, higher annual growth rates were recorded in the indices of the following commodity groups during the month:
a. Fish and other seafood, 0.2 percent from 0.1 percent;
b. Fruits and nuts, 4.4 percent from 3.1 percent; and
c. Ready-made food and other food products n.e.c., 2.5 percent from 1.7 percent.
In addition, slower year-on-year decline was noted in the index of corn at 18.9 percent in June 2025 from a 23.4 percent annual drop in the previous month.
In contrast, lower inflation rates were observed during the month in the indices of flour, bread, and other bakery products, pasta products, and other cereals at 5.3 percent from 5.9 percent in May 2025; meat and other parts of slaughtered land animals at 1.4 percent from 2.1 percent in the previous month; and oils and fats at 8.0 percent from 10.7 percent in May 2025.
Furthermore, faster annual decrement was observed in June 2025 in the index of rice at 25.0 percent in June 2025 from a year-on-year decline at 22.6 percent in the previous month.
2.2 Main Contributors to the Food Inflation
Food inflation contributed 144.4 percent share or -2.9 percentage point to the overall inflation in June 2025. The top two food groups in terms of contribution to the food inflation during the month were the following:
a. Cereals and cereal products, which includes rice, corn, flour, bread and other bakery products, pasta products, and other cereals, with 118.1 percent share or -7.0 percentage point; and
b. Vegetables, tubers, plantains, cooking bananas and pulses with 3.7 percent share or -0.2 percentage point.
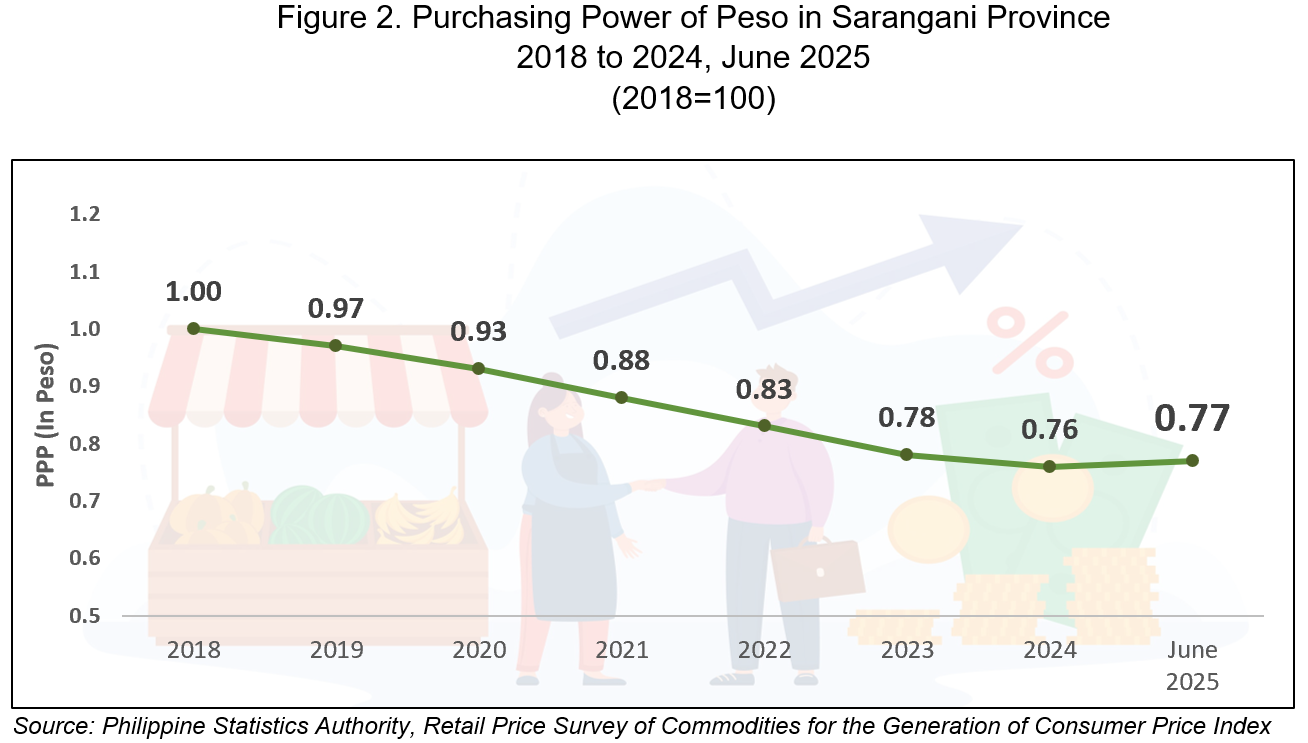
3. Purchasing Power of Peso
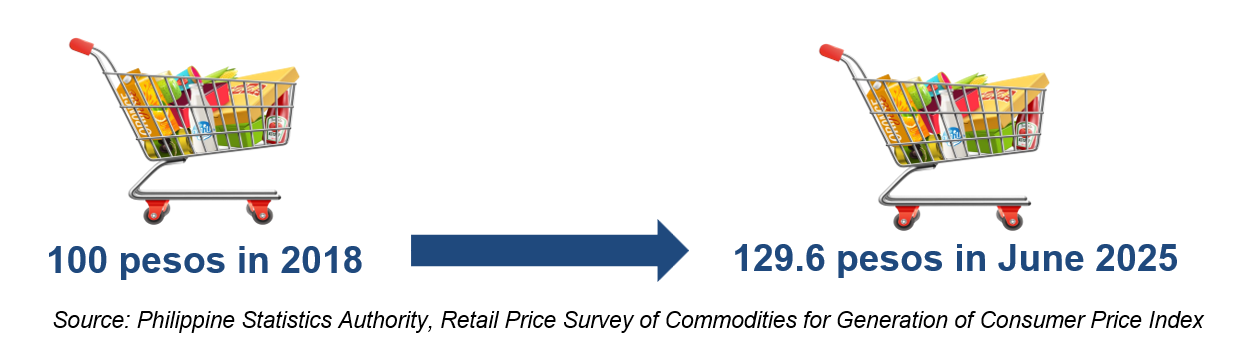
The Purchasing Power of Peso (PPP) in Sarangani Province remained at PhP 0.77 in June 2025 from the previous month. This implies that a peso in 2018 is only worth 77 centavos in June 2025, or you need PhP 129.60 to purchase the same volume of goods and services that cost Php 100.00 in 2018.
The PPP is inversely related to inflation rate. Therefore, as the inflation rate increases, PPP declines. In Sarangani Province, PPP has been decreasing on the average of 0.04 annually from 2018 to 2024. By comparison, the PPP in 2024 was 0.76 which implies that the PhP 1.00 in 2018 as the base year, values only PhP 0.76 in 2024. (Figure 2)
| Attachment | Size |
|---|---|
|
|
391.21 KB |