

Release Date :
Reference Number :
25R1280-SR-032
HIGHLIGHTS
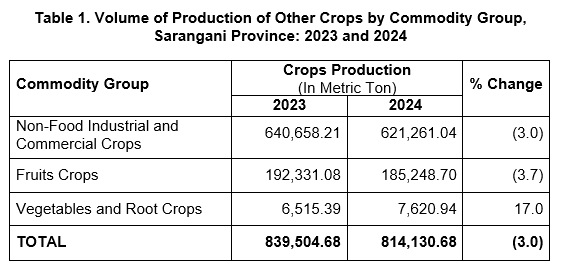
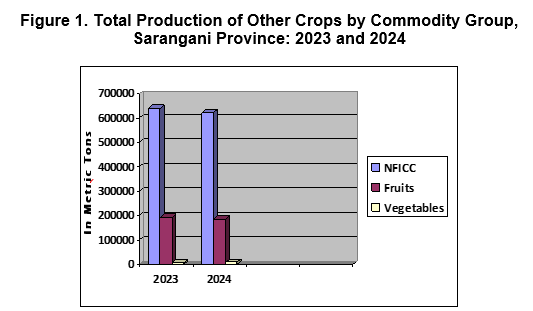
The total production of the different commodity groups, namely, fruit crops, vegetables and root crops, and non-food industrial and commercial crops in Sarangani Province decreased by 3.0 percent in 2024 compared to its production in 2023. The decline was attributed to the decreased production of fruits (-3.7%) and Non-food Industrial and Commercial Crops (-3.0%) (Table 1, Figure 1).
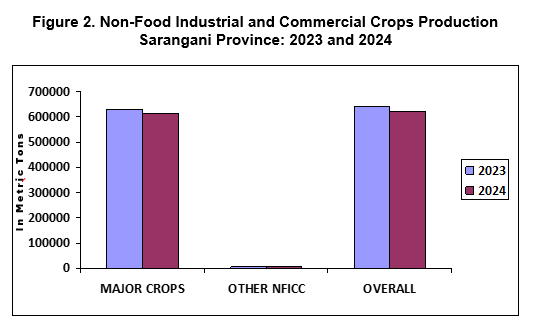
Non-Food Industrial and Commercial Crops Production
declines by 3.0 percent
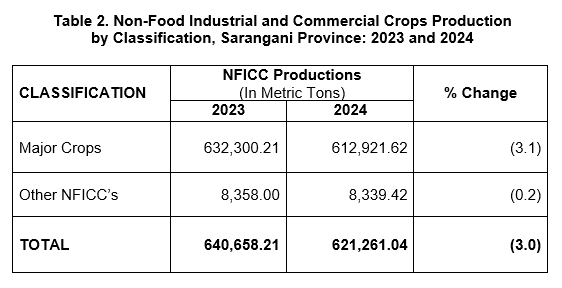
Non-Food Industrial and Commercial Crops (NFICC) production in the province was estimated at 621,261.04 metric tons, reflecting a decrease of 3.0 percent in 2024 compared to 2023 production of 640,658.21 metric tons. It can be noted that major crops on NFICCs registered a decline of 3.0 percent from 632,300.21 metric tons in 2023 to 612,921.62 metric tons in 2024, (Table 2, Figure 2).
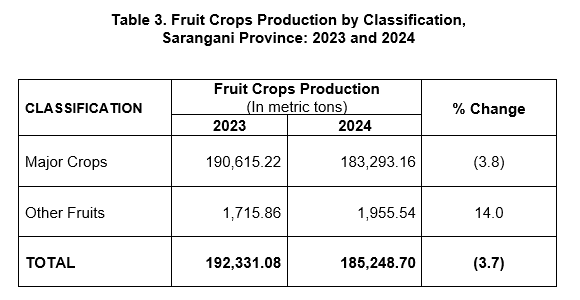
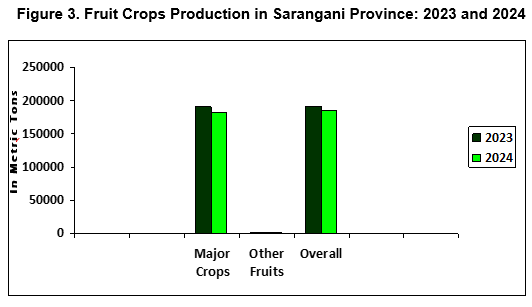
Fruit Crops Production in Sarangani Province Drops by 3.7 Percent
Fruit crops production in the province decreased by 3.7 percent from 192,331.08 metric tons in 2023 to 185,248.70 metric tons in 2024. The decline was attributed to the decrease in production of major fruits by 3.8 percent. Banana, the banner commodity, pulled down the production with a decrease of 4.7 percent. On the other hand, other fruits performed better with an increment of 14.0 percent. (Table 3, Figure 3).
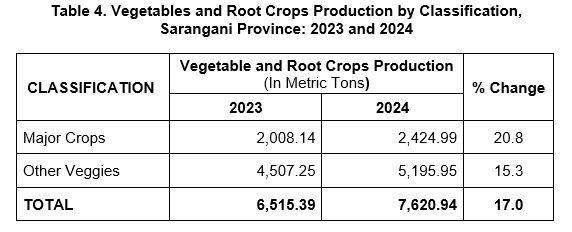
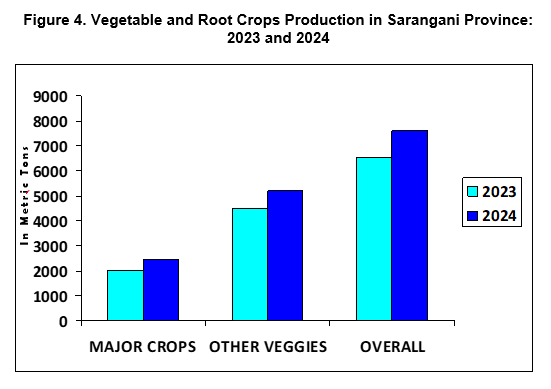
Vegetables and Root Crops Production up by 17.0 percent
Vegetable and Root Crops Production in Sarangani increased by 17.0 percent in 2024 compared to its level in 2023 at 6,515.39 metric tons. Among the crops’ classification, major vegetables and root crops production shared the largest increase in the total production of this commodity group with 20.8 percent compared to the previous year 2023. Moreover, other vegetables and root crops registered a growth of 15.3 percent. However, the Gabi Runner, Cauliflower, Kinchay, Red Kidney Beans, Chinese Cabbage, Cabbage and Habitchuelas showed the lowest and lesser indicators in production as it is not suitable and about to exclude in the provincial estimates, (Table 4, Figure 4).
NOTES:
Crop Production
Quantity produced and harvested for a particular crop during the reference period includes those harvested but damaged, stolen, given away, consumed, given as harvesters’ and threshers’ shares, reserved etc. Excluded are those produced but not harvested due to low prices, lack of demand and force majeure or fortuitous events, etc.
The survey aims to generate basic production statistics for crops other than palay and corn. There are three (3) groups generated in the survey: fruit crops, vegetables and root crops, and non-food industrial and commercial crops.
The purpose of the survey is to support the needs of planners, policy and decision makers, and other stakeholders in the agriculture sector and to provide periodic updates on crop related developments. It mainly captures the data on volume of production, area planted/ harvested, and number of bearing trees/hills/vines.
Major Crops
Top 19 crops, other than palay and corn which accounted for more than 60 percent of the total volume of crop production.

| Attachment | Size |
|---|---|
|
|
389.15 KB |