

Release Date :
Reference Number :
24R1280-PR-059
YEAR-ON-YEAR INFLATION RATES
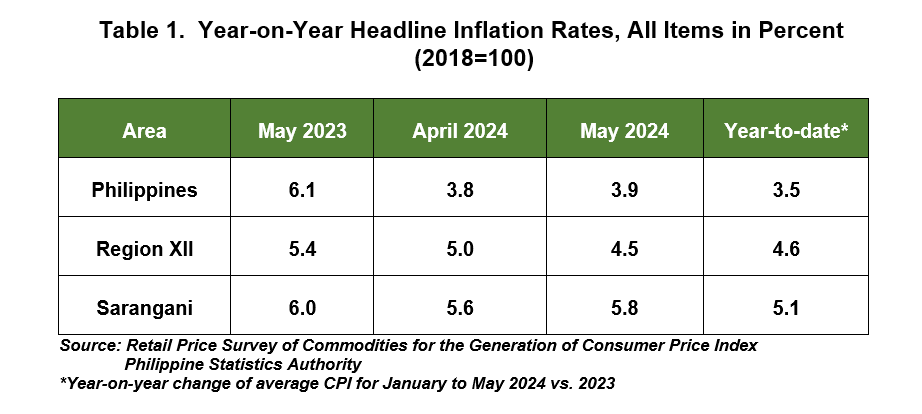
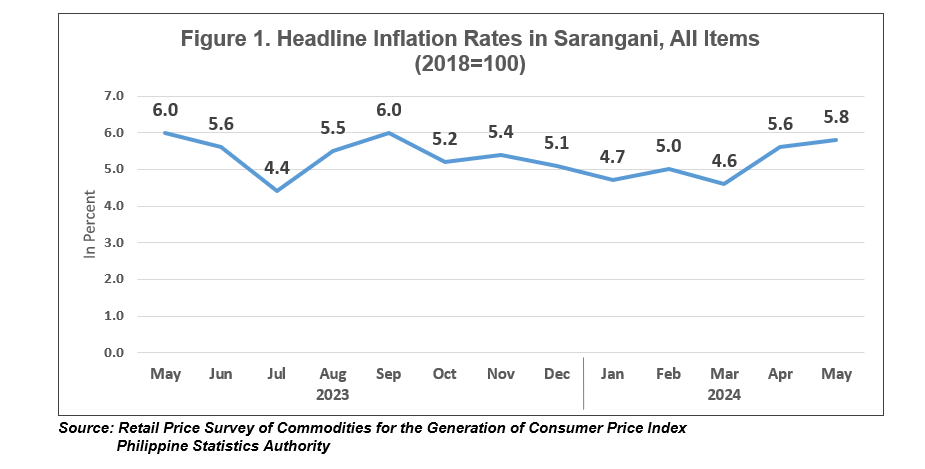
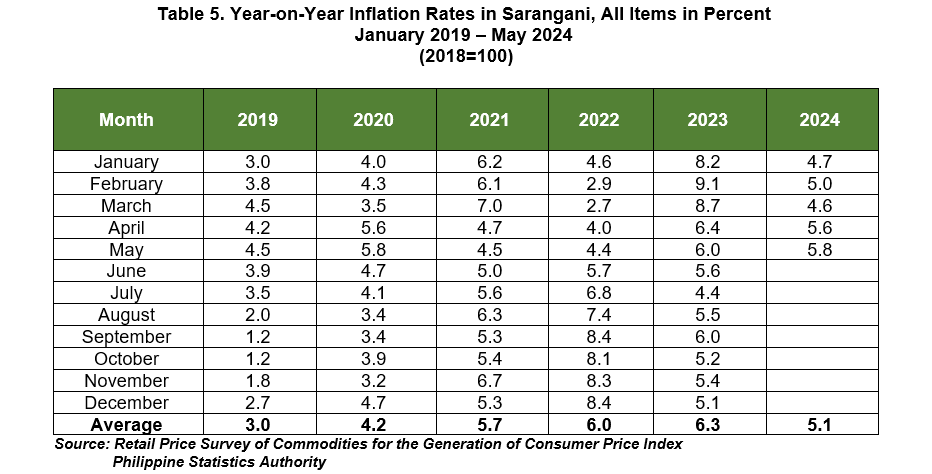
The headline inflation in Sarangani accelerated to 5.8 percent in May 2024 from 5.6 percent in April 2024. This is higher than the regional and national levels at 4.5 percent and 3.9 percent, respectively. In May 2023, the inflation rate was higher at 6.0 percent. The provincial average inflation from January to May 2024 averaged at 5.1 percent. (Table 1 and Figure 1).
The uptrend in the province’s inflation rate in May 2024 was primarily influenced by the year-on-year increase in the index of housing, water, electricity, gas and other fuels at 2.3 percent during the month from -1.6 percent inflation in April 2024. This was followed by recreation, sport and culture at 8.6 percent in May 2024 from 8.5 percent in April 2024. (Table 2)
Meanwhile, the following commodity groups registered lower inflation rates during the month:
a. Food and non-alcoholic beverages, 8.8 percent from 9.4 percent;
b. Alcoholic beverages and tobacco, 3.2 percent from 4.5 percent;
c. Clothing and footwear, 1.2 percent from 1.5 percent;
d. Furnishings, household equipment and routine household maintenance, 2.0 percent from 3.0 percent;
e. Health, 3.7 percent from 4.4 percent; and
f. Transport, 5.0 percent from 5.1 percent. (Table 2)
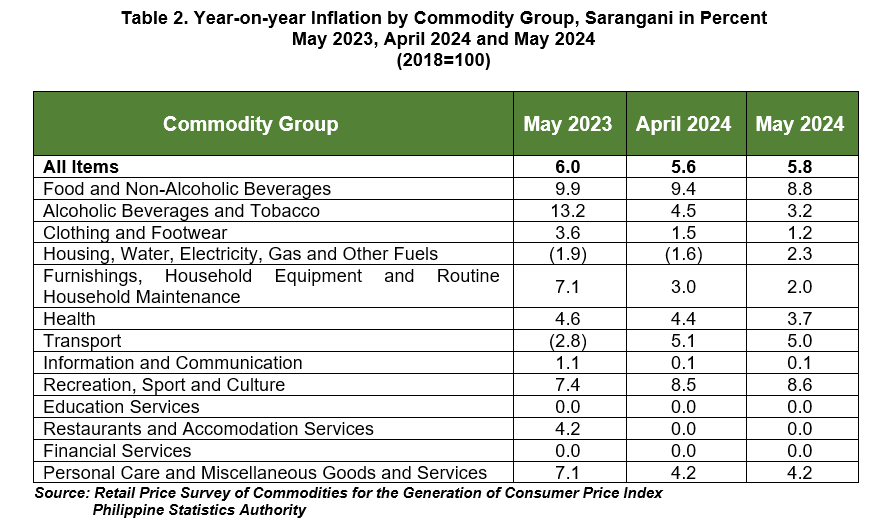
The indices of the rest of the commodity groups retained their previous month’s annual rates. (Table 2)
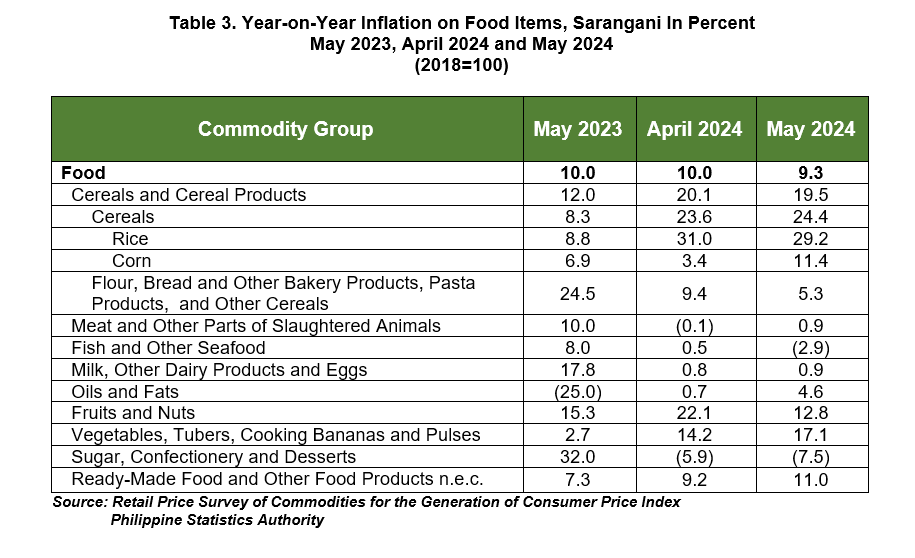
Sarangani’s food inflation slowed down to 9.3 percent in May 2024 from 10.0 percent in April 2024. In May 2023, food inflation was higher at 10.0 percent. (Table 3)
The deceleration of food inflation in May 2024 was due to the slower annual increase in fish and other seafood index at -2.9 percent in May 2024 from 0.5 percent in April 2024. This was followed by fruits and nuts at 12.8 percent in May 2024 from 22.1 percent in the previous month. Cereals and cereal products also contributed to the downtrend with 19.5 percent inflation rate in May 2024 from 20.1 percent in April 2024. Slower annual increments was also noted in sugar and confectionery and desserts at -7.5 percent during the month from -5.9 percent in April 2024. (Table 3)
In contrast, higher annual growth rates during the month were recorded in the indices of the following food groups:
a. Meat and other parts of slaughtered land animals, 0.9 percent from -0.1 percent;
b. Milk, other dairy products and eggs, 0.9 percent from 0.8 percent;
c. Oils and fats, 4.6 percent from 0.7 percent;
d. Vegetables, tubers, plantains, cooking bananas and pulses, 17.1 percent from 14.2 percent; and
e. Ready-made food and other food products n.e.c., 11.0 percent from 9.2 percent. (Table 3)
The inflation for housing, water, electricity, gas and other fuels index continued to move upward at 2.3 percent in May 2024 from -1.6 percent in April 2024. This was primarily due to the higher annual growth of electricity at 10.3 percent in May 2024 from -8.8 percent in April 2024. This was followed by gas at 0.6 percent during the month from 0.3 percent in April 2024. Security equipment and materials for the maintenance and repair of the dwelling also contributed to the uptrend with -2.7 percent in May 2024 from -2.8 percent in April 2024. Higher annual increments was also observed in liquid fuels at 10.0 percent in May 2024 and 9.8 percent in the previous month. (Table 4)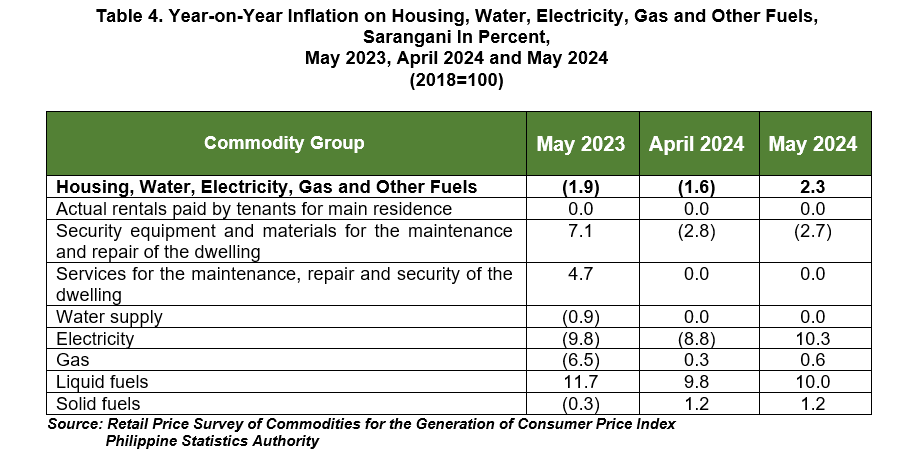
| Attachment | Size |
|---|---|
|
|
392.27 KB |