

Release Date :
Reference Number :
24R1280-PR-020
YEAR-ON-YEAR INFLATION RATES
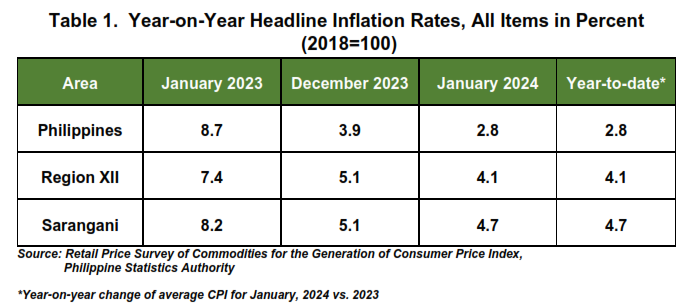
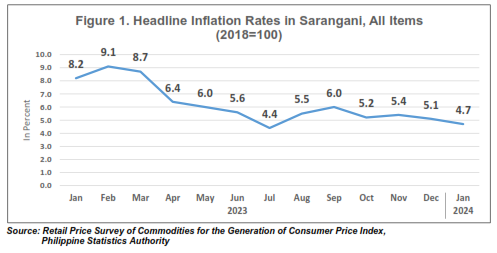
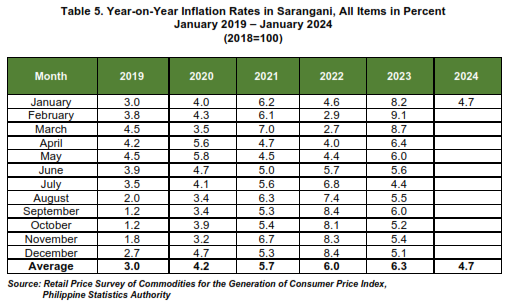
The headline inflation in Sarangani decreased further to 4.7 percent in January 2024 from 5.1 percent in December 2023. This is higher than the national and regional levels at 2.8 percent and 4.1 percent, respectively. Inflation rate in January 2023 was higher at 8.2 percent. Average inflation for the first month of the year was observed at 4.7 percent. (Table 1 and Figure 1).
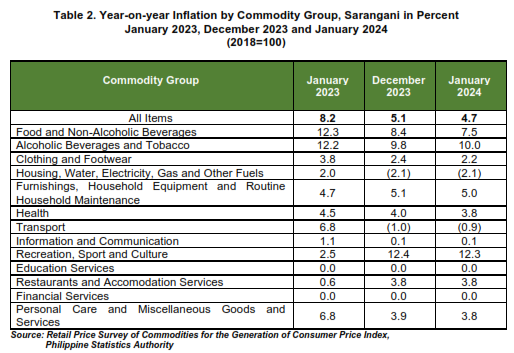
The downtrend in the province’s inflation rate in January 2024 was mainly due to the lower annual increase in the indices of food and non-alcoholic beverages at 7.5 percent from 8.4 percent in December 2023. This was followed by clothing and footwear at 2.2 percent from 2.4 percent, and personal care, and miscellaneous goods and services at 3.8 percent from 3.9 percent in the previous month. (Table 2)
The following commodity groups also contributed to the downtrend, namely:
a. Furnishings, household equipment and routine household maintenance, at 5.0 percent from 5.1 percent;
b. Health, at 3.8 percent and 4.0 percent; and
c. Recreation, sport and culture; at 12.3 percent and 12.4 percent.
On the other hand, annual increases were higher in the indices of alcoholic beverages and tobacco at 10.0 percent from 9.8 percent and transport at -0.9 percent from -1.0 percent in December 2023.
The rest of the commodity groups retained their previous month’s annual rates. (Table 2)
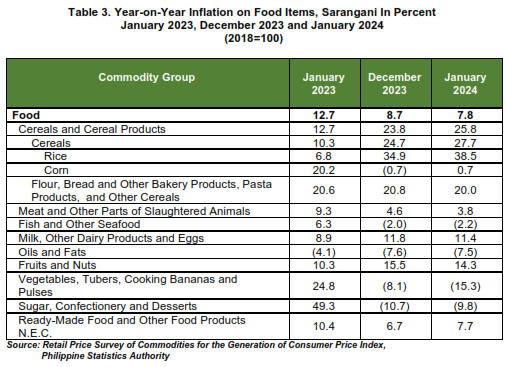
Food inflation in January 2024 decreased to 7.8 percent from 8.7 percent in December 2023. In January 2023, food inflation was higher at 12.7 percent. (Table 3)
The top three food groups that contributed to the decrease in food inflation were vegetables, tubers, plantains, cooking bananas and pulses at -15.3 percent from -8.1 percent, followed by meat and other parts of slaughtered land animals at 3.8 percent from 4.6 percent, and fruits and nuts at 14.3 percent from 15.5 percent in December 2023.
Lower annual increments were also recorded in the following food groups:
a. Fish and other seafood, at -2.2 percent from -2.0 percent; and
b. Milk, other dairy products and eggs, at 11.4 percent from 11.8 percent.
Meanwhile, higher annual increments were noted in the following food groups:
a. Rice, at 38.5 percent from 34.9 percent;
b. Corn, at 0.7 percent from -0.7 percent;
c. Oils and fats, at -7.5 percent from -7.6 percent;
d. Sugar, confectionery and desserts, at -9.8 percent from -10.7 percent; and
e. Ready-made food and other food products n.e.c., at 7.7 percent from 6.7 percent.
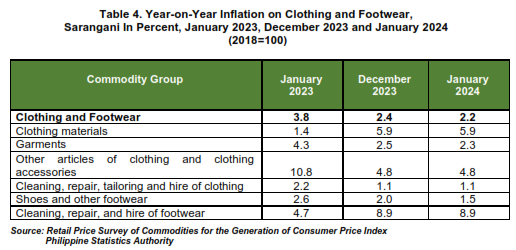
Inflation for clothing and footwear, on the other hand, decreased to 2.2 percent in January 2024 from 2.4 percent in December 2023. Under the clothing and footwear group, shoes and other footwears recorded to have a slower price adjustment with 1.5 percent from 2.0 percent in the previous month. Also, contributing to the downtrend is the index of garments at 2.3 percent from 2.5 percent in December 2023. Other commodity groups retained the previous month’s inflation. (Table 4)
Definition of Terms
Base Period/Year - this refers to the period, usually a year, at which the index number/points is set to 100. It is the point of index number series.
Consumer Price Index - the average retail prices of a fixed basket of goods and services commonly purchased by households relative to a base year
Inflation Rate - the annual rate of change or year-on-year change in the CPI expressed in percent
Market Basket - refers to a sample of goods and services that are commonly purchased and bought by an average Filipino household
Weights - a system that considers the relevance of the components of the in
| Attachment | Size |
|---|---|
|
|
325.57 KB |