

Release Date :
Reference Number :
24R1280-PR-030
YEAR-ON-YEAR INFLATION RATES
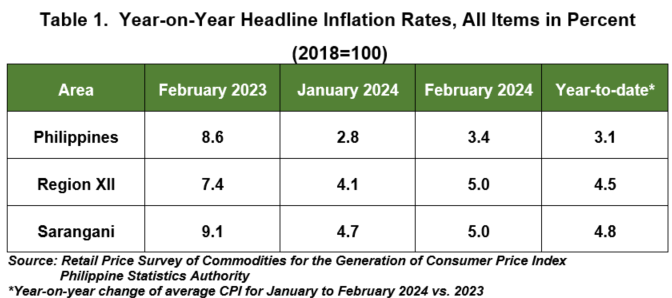
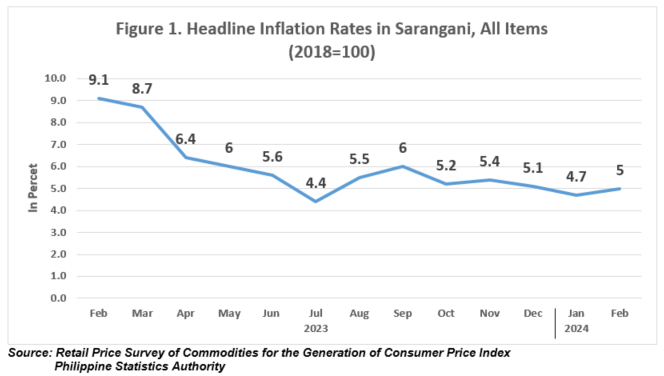
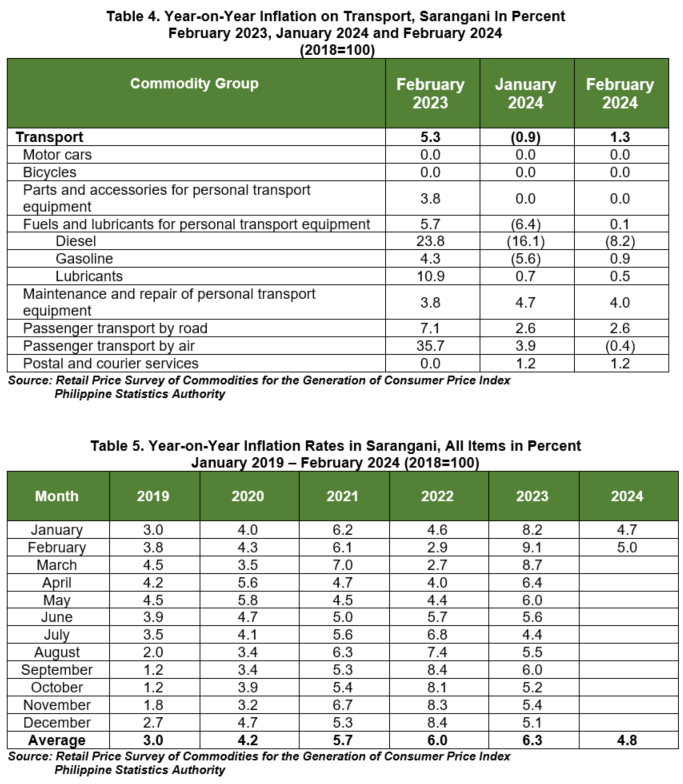
The headline inflation in Sarangani increased to 5.0 percent in February 2024 from 4.7 percent in January 2024. This is higher than the national level at 3.4 percent and same with the regional level. The inflation rate in February 2023 was higher at 9.1 percent. The inflation for the first two months of the year averaged 4.8 percent. (Table 1 and Figure 1).
The acceleration in the province’s inflation rate in February 2024 was primarily due to the annual increase in the transport index at 1.3 percent from -0.9 percent inflation in January 2024. This was followed by the indices of housing, water, electricity, gas and other fuels at -1.5 percent from -2.1 percent and food and non-alcoholic beverages at 7.6 percent from 7.5 percent in January 2024. (Table 2).
Also contributed to the uptrend are the following commodity groups:
a. Alcoholic beverages and tobacco, at 10.8 percent from 10.0 percent;
b. Personal care, and miscellaneous goods and services, at 3.9 percent from 3.8 percent; and
c. Health, at 4.0 percent from 3.8 percent. (Table 2)
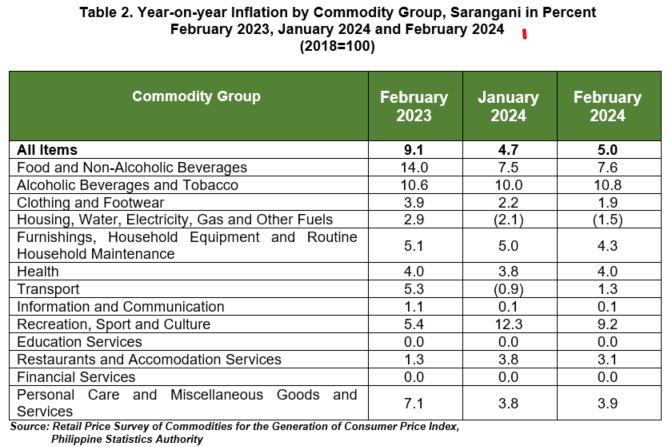
Meanwhile, lower inflation rates were observed in clothing and footwear at 1.9 percent from 2.2 percent, furnishings, household equipment, and routine household maintenance at 4.3 percent to 5.0 percent, recreation, sport, and culture at 9.2 percent from 12.3 percent, and restaurants and accommodation services at 3.1 percent from 3.8 percent in January 2024. The rest of the commodity groups retained their previous month’s annual rates. (Table 2)
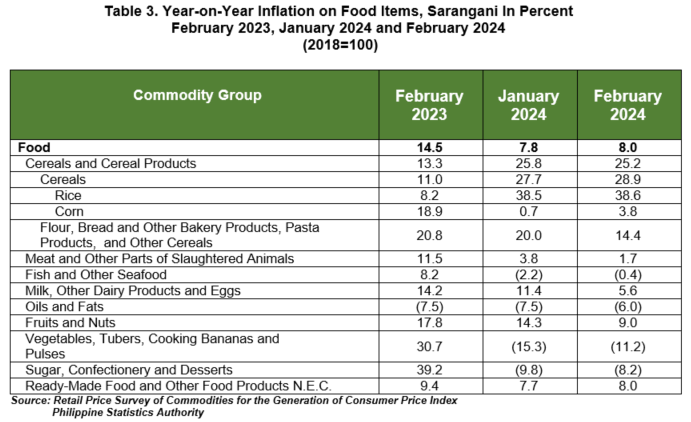
The food inflation in February 2024 increased to 8.0 percent from 7.8 percent in January 2024. In February 2023, food inflation was higher at 14.5 percent. (Table 3)
The top three food groups that contributed to the increase in food inflation were vegetables, tubers, plantains, cooking bananas, and pulses at -11.2 percent, followed by fish and other seafood at -0.4 percent from -2.2 percent and, sugar, confectionery, and desserts at -8.2 percent and -9.8 percent in January 2024. (Table 3)
Higher annual increments were also observed in the following food groups:
a. Oils and fats, at -6.0 percent from -7.5 percent;
b. Ready-made food and other food products n.e.c., at 8.0 percent from 7.7 percent;
c. Rice, at 38.6 percent from 38.5 percent; and
d. Corn, at 3.8 percent from 0.7 percent.
On the other hand, lower annual increments were noted in the following food groups:
a. Flour, bread and other bakery products, pasta products, and other cereals, at 14.4 percent from 20.0 percent;
b. Meat and other parts of slaughtered land animals, at 1.7 percent from 3.8 percent;
c. Milk, other dairy products and eggs, at 5.6 percent from 11.4 percent; and
d. Fruits and nuts, at 9.0 percent from 14.3 percent. (Table 3)
The inflation for transport increased to 1.3 percent in February 2024 from -0.9 percent in January 2024. This was primarily due to the higher annual growth of gasoline at 0.9 percent from -5.6 percent and, diesel at -8.2 percent from -16.1 percent in January 2024. (Table 4)
Definition of Terms
Base Period/Year this refers to the period, usually a year, at which the index number/points is set to 100. It is the point of index number series.
Consumer Price Index the average retail prices of a fixed basket of goods and services commonly purchased by households relative to a base year
Inflation Rate the annual rate of change or year-on-year change in the CPI expressed in percent
Market Basket refers to a sample of goods and services that are commonly purchased and bought by an average Filipino household
Weights a system that considers the relevance of the components of the index
Approved for Release:
(SGD)ISMAEL B. RAMOS JR.
Chief Statistical Specialist
For inquiries, please contact:
(SGD)MARIFI P. DE ASIS
Supervising Statistical Specialist
Telephone Number (083) 552-2502
| Attachment | Size |
|---|---|
|
|
767.67 KB |