

Release Date :
Reference Number :
24R1280-PR-060
YEAR-ON-YEAR INFLATION RATES
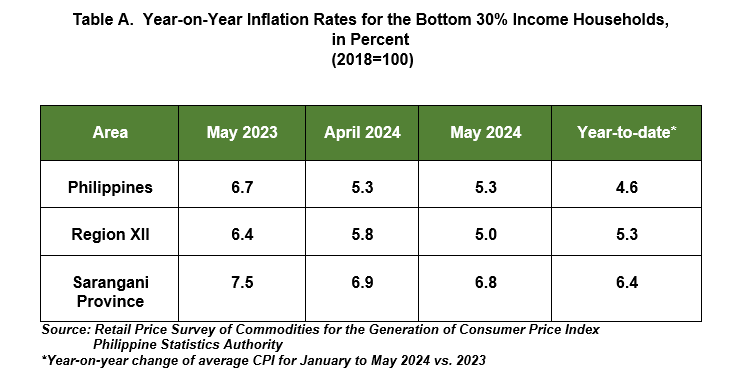
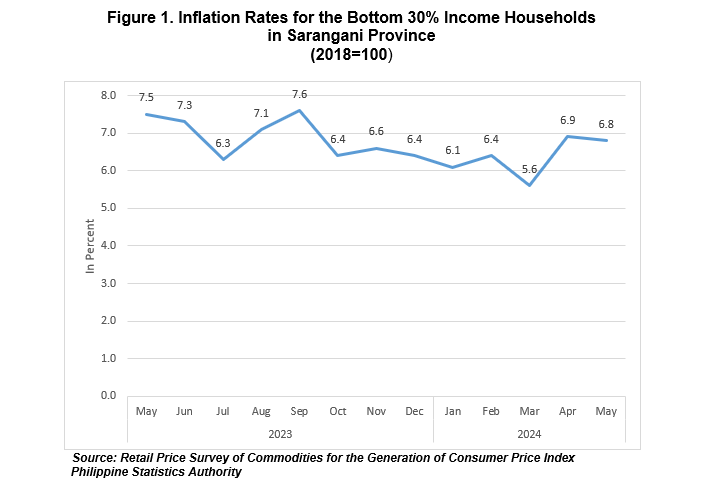
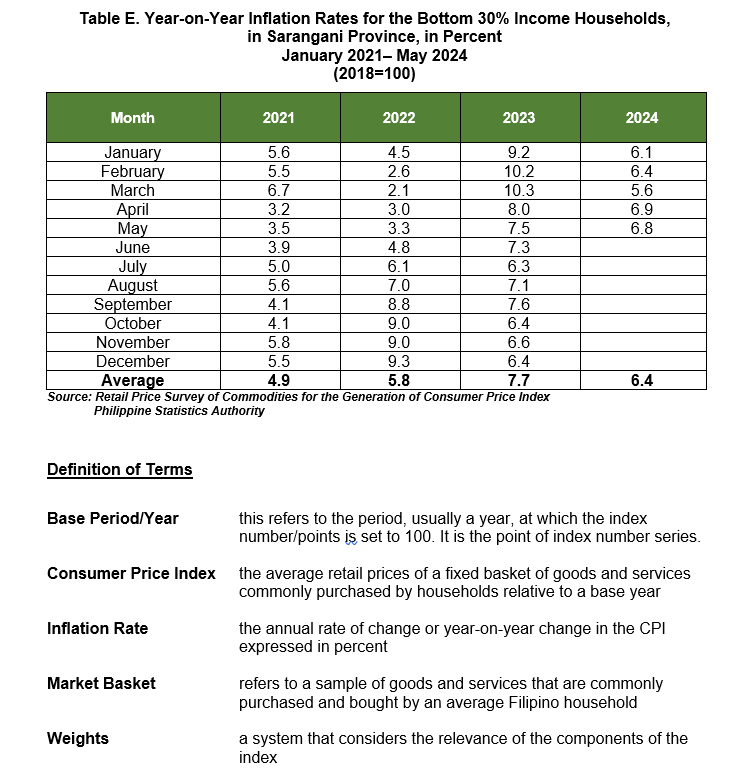
The inflation or the annual rate of change on the prices of goods and services in the market basket for the bottom 30% income households or the low-income group in Sarangani Province decreased to 6.8 percent in May 2024 from last month’s inflation at 6.9 percent. This was higher than the regional and national levels at 5.0 percent and 5.3 percent, respectively. This was however, lower by 0.7 percentage points from a year ago of the same month at 7.5 percent. The average inflation or the year-to-date inflation of the province was recorded at 6.4 percent.
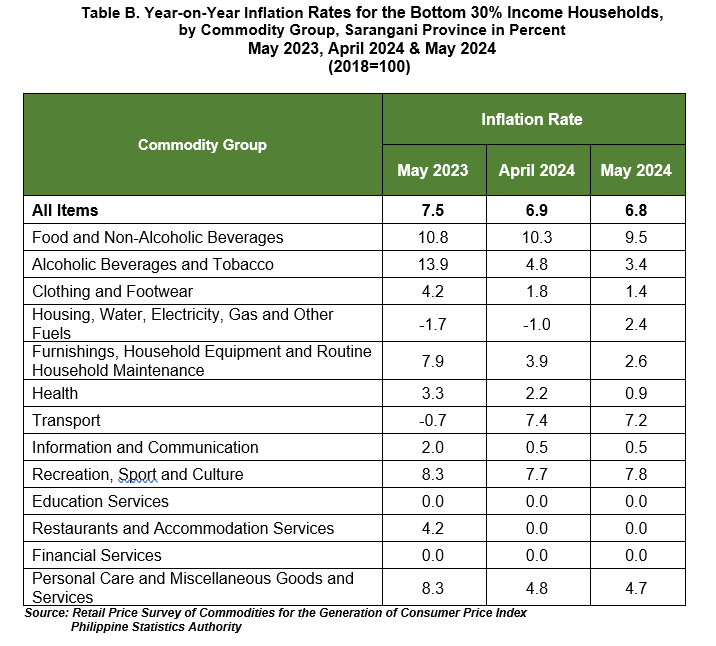
The main contributors to the province’s downtrend inflation for the bottom 30% income households for the month of May 2024 are as follows:
a) Food and non-alcoholic beverages, 9.5% from 10.3%;
b) Alcoholic beverages and tobacco, 3.4% from 4.8%;
c) Furnishing, household equipment and routine household, 2.6% from 3.9%;
d) Health, 0.9% from 2.2%;
e) Transport, 7.2% from 7.4%;
f) Clothing and footwear, 1.4% from 1.8%; and
g) Personal care and miscellaneous goods and services, 4.7% from 4.8%;
Food and non-alcoholic beverages contributed 79.2% to this downtrend, while alcoholic beverages and tobacco at 8.2% and furnishing, household equipment and routine household at 5.9%.
Meanwhile, the following commodity groups showed an upward trend for the bottom 30% income households for the month of May 2024:
a) Housing, water, electricity, gas and other fuels, 2.4% from -1.0%; and
b) Recreation, sport and culture, 7.8% from 7.7%.
The rest of the commodity groups: Information and communication; education services; restaurants and accommodation services and financial services maintained their previous month’s inflation rates. (Table B)
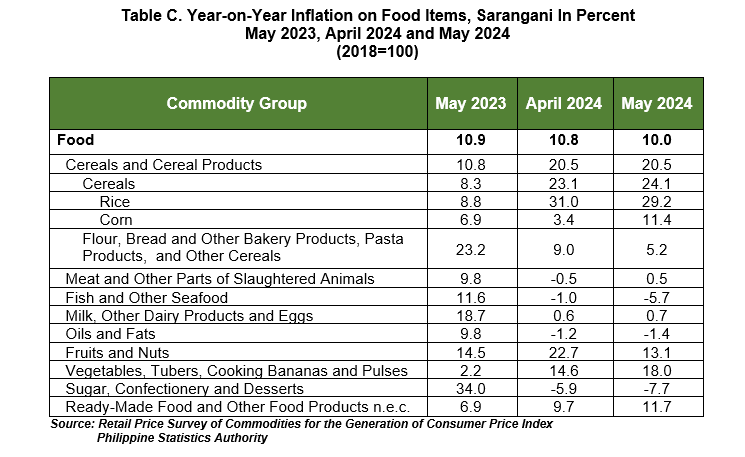
Sarangani’s food inflation the bottom 30% households slowed down to 10.0 percent in May 2024 from 10.8 percent in April 2024. In May 2023, food inflation the bottom 30% households was higher at 10.9 percent. (Table C)
The deceleration of food inflation the bottom 30% households in May 2024 was due to the slower annual increase in fish and other seafood index at -5.7 percent in May 2024 from -1.0 percent in April 2024. This was followed by fruits and nuts at 13.1 percent in May 2024 from 22.7 percent in the previous month. Sugar, confectionery and desserts also contributed to the downtrend with -7.7 percent inflation rate in May 2024 from -5.9 percent in April 2024. Slower annual increments was also noted in oils and fats at -1.4 percent during the month from -1.2 percent in April 2024. (Table C)
In contrast, higher annual growth rates during the month were recorded in the indices of the following food groups:
a. Meat and other parts of slaughtered land animals, 0.5 percent from -0.5 percent;
b. Milk, other dairy products and eggs, 0.7 percent from 0.6 percent;
c. Vegetables, tubers, plantains, cooking bananas and pulses, 18.0 percent from 14.6 percent; and
d. Ready-made food and other food products n.e.c., 11.7 percent from 9.7 percent. (Table C)
Cereal and cereal products remained its previous months’ inflation rate.
Food and Non-Alcoholic Beverages decreased by 9.5 percent in May 2024 from 10.3 percent in April 2024.
Moreover, slower annual increases were recorded in the indices of the following:
a) Fish and other seafood, -5.7% from -1.0%;
b) Fruits and nuts, 13.1% from 22.7%;
c) Sugar, confectionery and desserts, -7.7% from -5.9%;
d) Coffee and coffee substitutes, 2.1% from 2.7%;
e) Other non-alcoholic beverages, 3.3% from 4.7%;
f) Oils and fats, -1.4% from -1.2%; and
g) Tea, mate and other plant products for infusion, 4.9% from 5.0%.
Please see Table D for the year-on-year inflation on Food and Non-Alcoholic Beverages group in percent.


| Attachment | Size |
|---|---|
|
|
297.88 KB |