

Release Date :
Reference Number :
24R1280-PR-105
YEAR-ON-YEAR INFLATION RATES
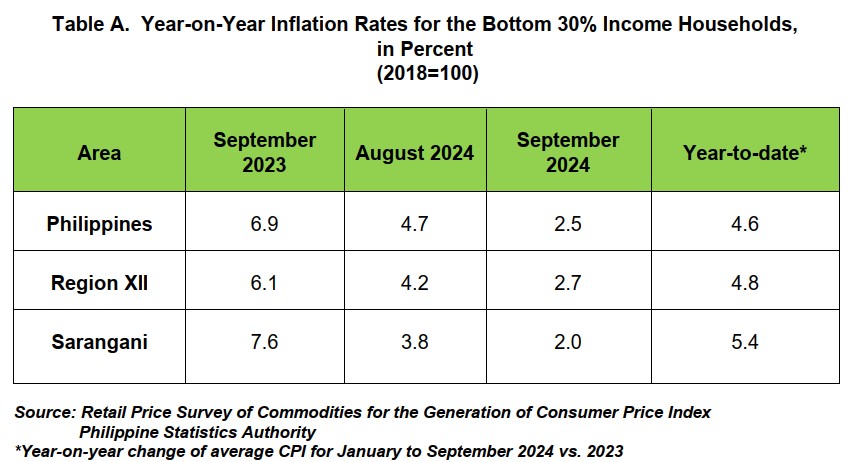
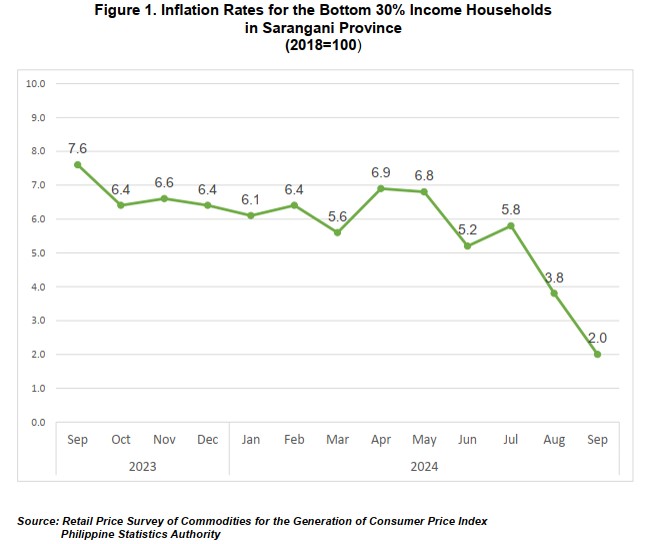
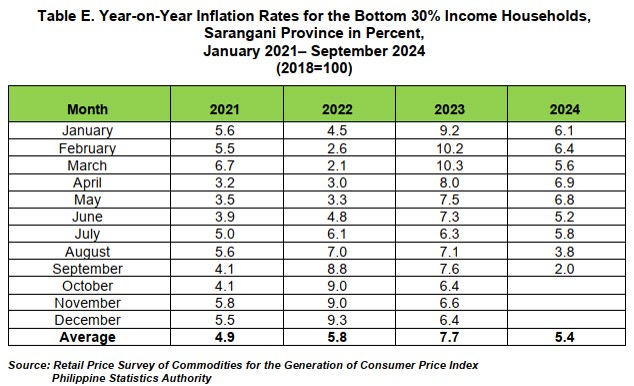
The inflation or the annual rate of change on the prices of goods and services in the market basket for the bottom 30% income households or the low-income group in Sarangani Province reduced to 2.0 percent in September 2024 from last month’s inflation at 3.8 percent. This was lower than the regional and national levels at 2.7 percent and 2.5 percent, respectively. Moreover, the rate was lower by 5.6 percentage points from a year ago of the same month at 7.6 percent. The average inflation or the year-to-date inflation of the province was recorded at 5.4 percent.
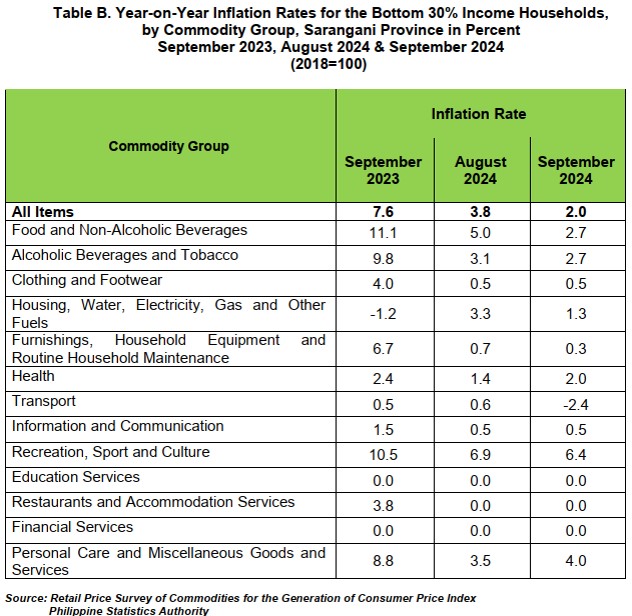
The major contributor to the province’s downtrend inflation for the bottom 30% income households for the month of September 2024 was the food and non-alcoholic beverages with 2.7 percent inflation from 5.0 percent of the previous month which contributed 74.3 percent to the overall inflation. This was followed by housing, water, electricity, gas and other fuels with 1.3 percent in September 2024 from 3.3 percent in August and transport with -2.4 percent during the month from 0.6 percent in the previous month.
The following commodity groups also contributed to the downtrend inflation during the month:
a) Alcoholic beverages and tobacco, 2.7 percent from 3.1 percent;
b) Furnishings, household equipment and routine household maintenance, 0.3 percent from 0.7 percent; and
c) Recreation, sport and culture, 6.4 percent from 6.9 percent. (Table B)
In contrary, the health and personal care and miscellaneous goods and services registered an upward trend for the bottom 30% income households during the month with 2.0 percent from 1.4 percent and 4.0 percent from 3.5 percent, respectively. (Table B)
Furthermore, the following commodity groups maintained their previous month’s inflation rates:
a) Clothing and Footwear, at 0.5 percent;
b) Information and communication, at 0.5 percent;
c) Education services, at 0.0 percent;
d) Restaurants and accommodation services, at 0.0 percent; and
e) Financial services, at 0.0 percent. (Table B)
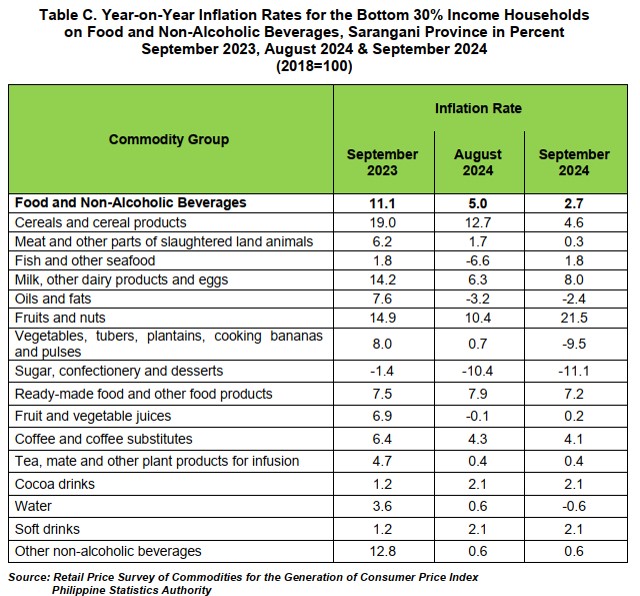
The major contributor to the deceleration of inflation in the food and non-alcoholic beverages in the bottom 30% income households was cereals and cereal products with 4.6 percent in September 2024 from 12.7 percent in the previous month which shared 77.7 percent. This was followed by vegetables, tubers, plantains, cooking bananas and pulses with -9.5 percent from 0.7 percent inflation in August 2024 and meat and other parts of slaughtered land animals with 0.3 percent from 1.7 percent in the previous month.
Other commodity groups also contributed to the downtrend inflation during the month were as follows:
a) Ready-made food and other food products, 7.2 percent from 7.9 percent;
b) Sugar, confectionery and desserts, -11.1 percent from -10.4 percent;
c) Coffee and coffee substitutes, 4.1 percent from 4.3 percent; and
d) Water, -0.6 percent from 0.6 percent (Table C)
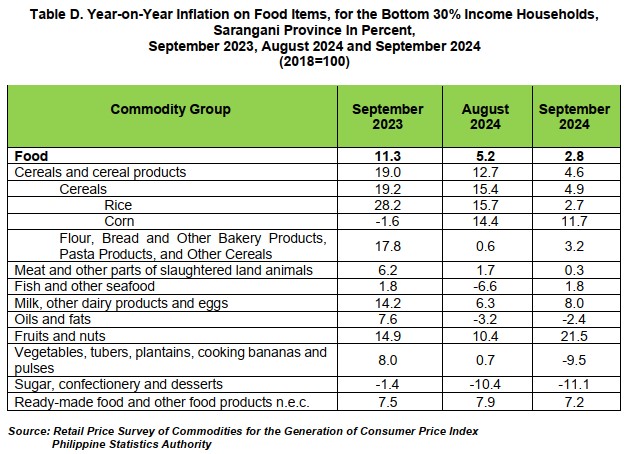
Meanwhile, Sarangani Province’s food inflation for the bottom 30% income households declined to 2.8 percent in September 2024 from 5.2 percent in August 2024. In September 2023, food inflation for the bottom 30% income households was higher at 11.3 percent. (Table D)
The deceleration of food inflation for the bottom 30% income households in September 2024 was due to the decrease in the indices of the following:
a) Cereals and cereal products, 4.6 percent from 12.7 percent;
b) Vegetables, tubers, plantains, cooking bananas and pulses, -9.5 percent from 0.7 percent;
c) Meat and other parts of slaughtered land animals, 0.3 percent from 1.7 percent;
d) Ready-made food and other food products n.e.c, 7.2 percent from 7.9 percent; and
e) Sugar, confectionery and desserts, -11.1 percent from -10.4 percent.
In contrast, increased annual growth rates during the month were recorded in the indices of the following:
a) Fish and other seafoods, 1.8 percent from -6.6 percent;
b) Milk, other dairy products and eggs, 8.0 percent from 6.3 percent;
c) Oils and fats, -2.4 percent from -3.2 percent; and
d) Fruits and nuts, 21.5 percent from 10.4 percent. (Table D)

| Attachment | Size |
|---|---|
|
|
271.34 KB |