

Release Date :
Reference Number :
2025SR – 1263 - 002
Date of Release: 13 February 2025
Reference No.: 2025SR – 1263 - 002
YEAR-ON-YEAR INFLATION RATES
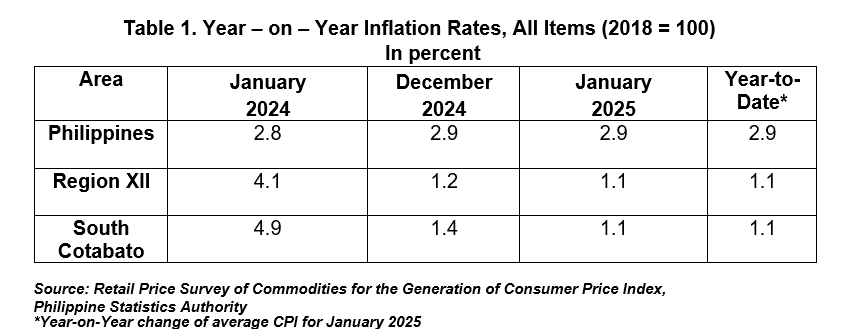
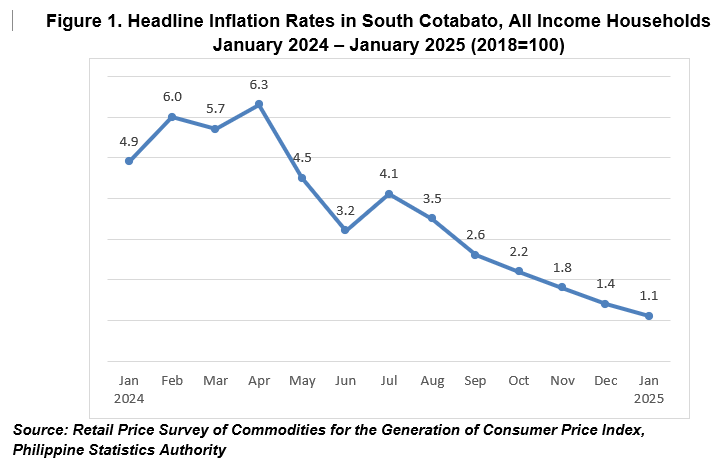
The headline inflation or the annual rate of change on the prices of goods and services in the market basket of South Cotabato decreased to 1.1 percent in January 2025. It was lower by 3.8 percentage points from the same month last year at 4.9 percent and 0.3 percentage point lower from December 2024 at 1.4 percent. South Cotabato’s inflation was lower by 1.8 percentage points compared to the national estimate. The year-to-date provincial average inflation rate stood at 1.1 percent (Table 1).
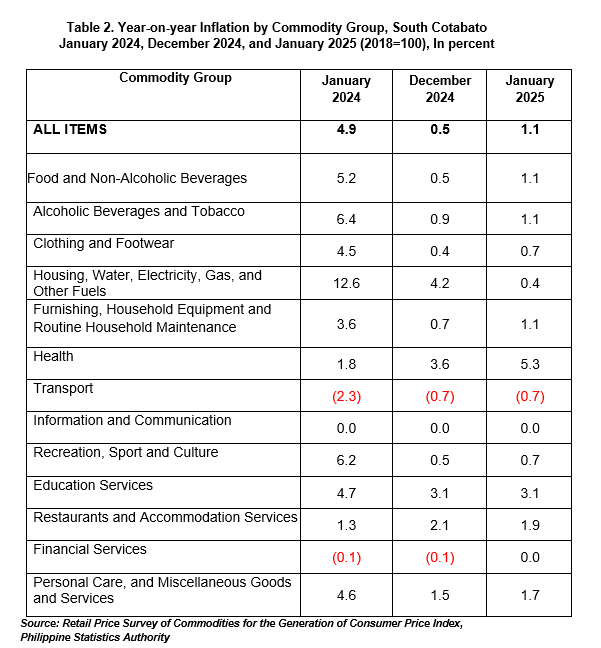
The major contributors to the downtrend in the province’s inflation rate for the month of January 2025 were Housing, Water, Electricity, Gas, and other Fuels at 0.4 percent; and Restaurants and Accommodation Services at 1.9 percent.
Lower annual increments were noted in the indices of the following commodity groups:
a. Housing, Water, Electricity, Gas, and other Fuels, (from 4.2% to 0.4%);
b. Restaurants and Accommodation Services, (from 2.1% to 1.9%).
Higher annual increments were noted in, Health (from 3.6% to 5.3%), Food and Non-Alcoholic Beverages (from 0.5% to 1.1%), Alcoholic Beverages (from 0.9% to 1.1%), Clothing and Footwear (from 0.4% to 0.7), Furnishing, Household Equipment and Routine Household Maintenance (from 0.7% to 1.1%), Recreation, Sports and Culture (from 0.5% to 0.7%), Financial Services (from -0.1% to 0.0%), and Personal Care, and Miscellaneous Goods and Services (from 1.5% to 1.7
The rest of the commodity groups: Transport (-0.7%), Information and Communication (0.0%), and Education Services (3.1%) maintained their previous month’s inflation rates. (Table 2)
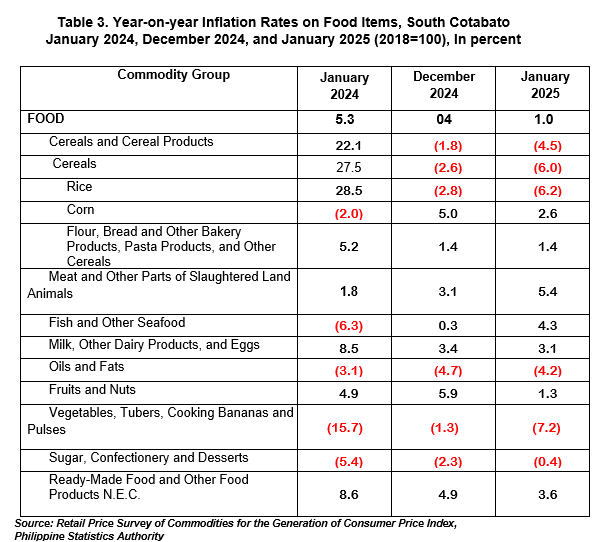
Meanwhile, inflation for food increased to 1.0 percent in January 2025 from 0.4 percent in December 2024. In January 2024, food inflation was higher at 5.3 percent (Table 3).
The top three food groups that contributed to the increased in food inflation were Fish and other seafood (from 0.3% to 4.3%), Vegetables, tubers, plantains, cooking bananas and pulses (from -1.3% to 7.2%), and Meat and other parts of slaughtered land animals (from 3.1% to 5.4%).

| Attachment | Size |
|---|---|
|
|
301.55 KB |