A. General Santos City
1. Overall Inflation
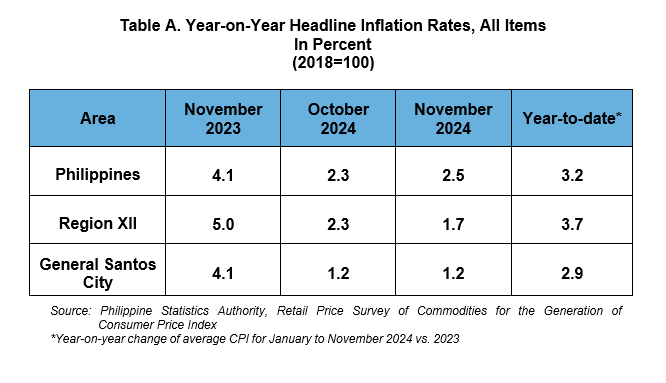
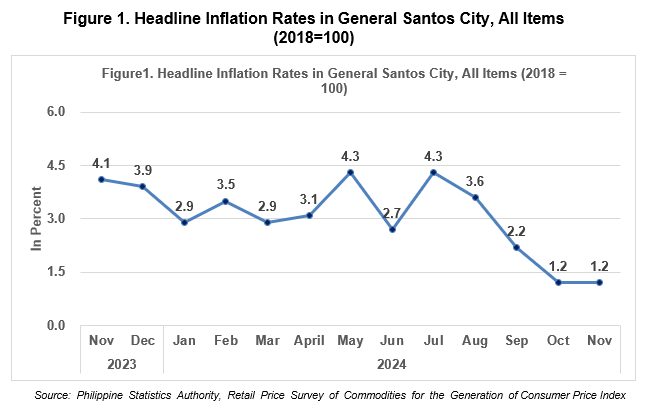
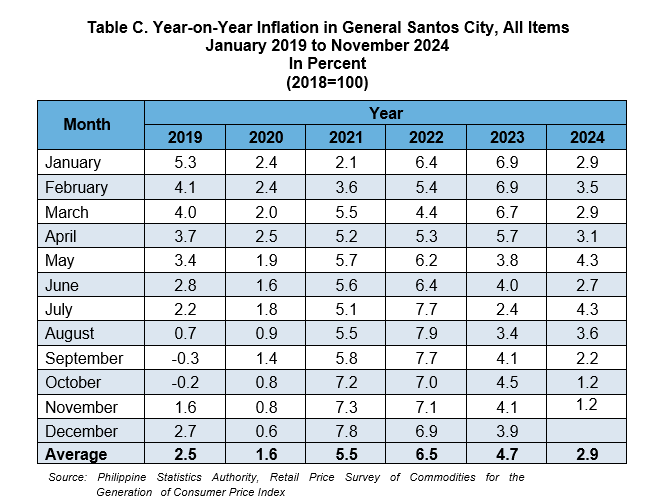
The headline inflation or the annual rate of change in the prices of goods and services in the market basket in General Santos City retained its level at 1.2 percent in November 2024 from the previous month October 2024. It was lower than the national level at 2.5 percent and the regional level at 1.7 percent. The city level average inflation from January to November 2024 stood at 2.9 percent. In November 2023, the inflation rate was higher at 4.1 percent. (Table A and Figure 1)
1.1 Main Contributors to the Overall Inflation
The top three commodity groups contributing to the November 2024 overall inflation were the following:
a. Food and non-alcoholic beverages with 2.2 percent inflation which contributed 75.2 percent share or 0.9 percentage point;
b. Education services with 8.7 percent inflation contributing 17.2 percent share or 0.2 percentage point; and
c. Housing, water, electricity, gas and other fuels with 0.8 percent inflation which contributed 13.3 percent share or 0.2 percentage point.
2. Food Inflation
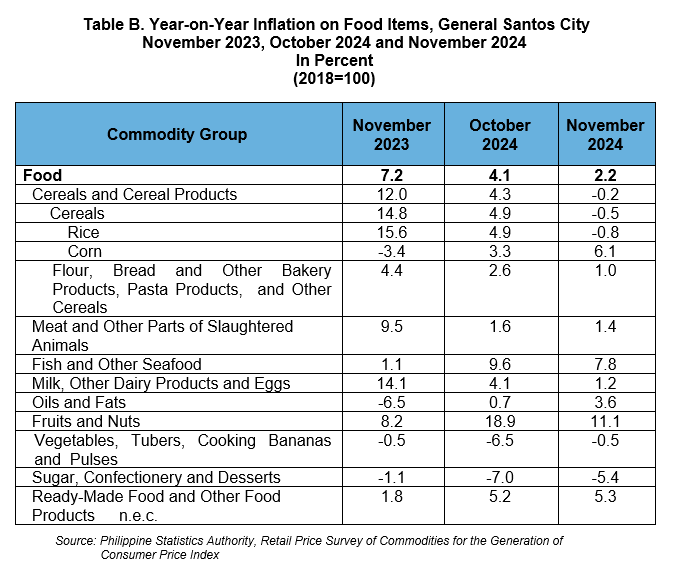
Food inflation in General Santos City decelerated to 2.2 percent in November 2024 from 4.1 percent in the previous month. In November 2023, food inflation was higher by 5.0 percentage points at 7.2 percent. (Table B)
2.1 Main Drivers to the Downward Trend of the Food Inflation
The deceleration of food inflation in November 2024 was due to lower annual increase of rice with -0.8 percent from 4.9 percent in October 2024. Also, the index of fish and other seafood decreased to 7.8 percent in November 2024 from 9.6 percent in October 2024. The index of fruits and nuts also contributed to the downtrend with 11.1 percent during the month from 18.9 percent in October 2024.
Moreover, the following food groups contributed lower annual increments during the month:
a. Flour, bread and other bakery products, pasta products, and other cereals, 1.0 percent from 2.6 percent;
b. Meat and other parts of slaughtered land animals, 1.4 percent from 1.6 percent; and
c. Milk, other dairy products and eggs, 1.2 percent from 4.1 percent. (Table B)
In contrast, higher annual increments were noted in the indices of the following food groups during the month:
a. Corn, 6.1 percent from 3.3 percent;
b. Oils and fats, 3.6 percent from 0.7 percent;
c. Vegetables, tubers, plantains, cooking bananas and pulses, -0.5 percent from -6.5 percent;
d. Sugar, confectionery and desserts, -5.4 percent from -7.0 percent; and
e. Ready-made food and other food products n.e.c., 5.3 percent from 5.2 percent. (Table B)
2.2 Main Contributors to the Food Inflation
Food inflation contributed 69.4 percent or 0.83 percentage point to the November 2024 overall inflation.
Among the food groups, the main contributors to the food inflation during the month were the following:
a) Fish and other seafood, with a share of 66.4 percent or 1.5 percentage points;
b) Fruits and nuts, with a share of 20.0 percent or 0.4 percentage point; and
c) Ready-made food and other food products n.e.c., with a share of 9.7 percent or 0.2 percentage point.
3. Purchasing Power of Peso

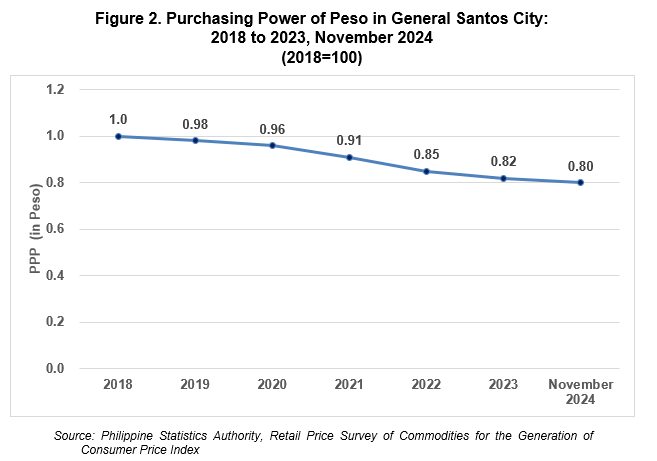
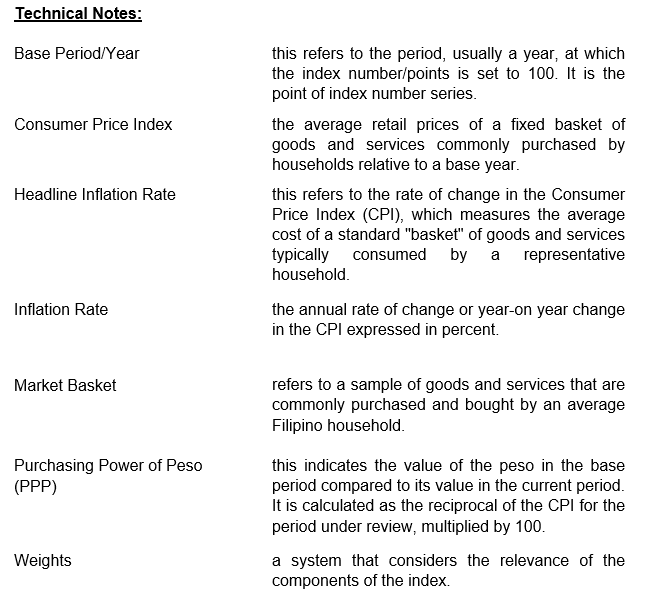
The Purchasing Power of Peso (PPP) in General Santos City retained its level at 0.80 in November 2024 from October 2024. This means that a peso in 2018 is only worth 80 centavos in November 2024, or you need PhP 125.70 to purchase the same volume of goods and services that cost PhP 100.00 in 2018.
The PPP is inversely related to inflation rate. Therefore, as the inflation rate decreases, PPP inclines. In General Santos City, PPP has been decreasing on the average of 0.04 annually from 2018 to 2023. By comparison, the PPP in 2023 was 0.82 which implies that the PhP 1.00 in 2018 as the base year, values only PhP 0.82 in 2023. (Figure 2)
