

Release Date :
Reference Number :
25R1280-SR-011
A. General Santos City
1. Overall Inflation
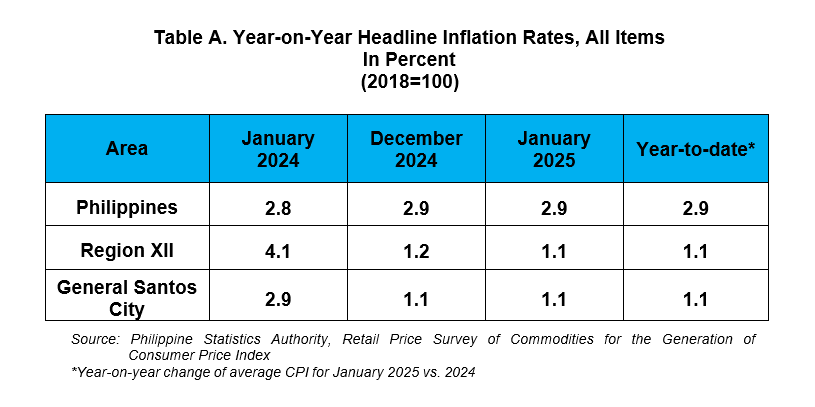
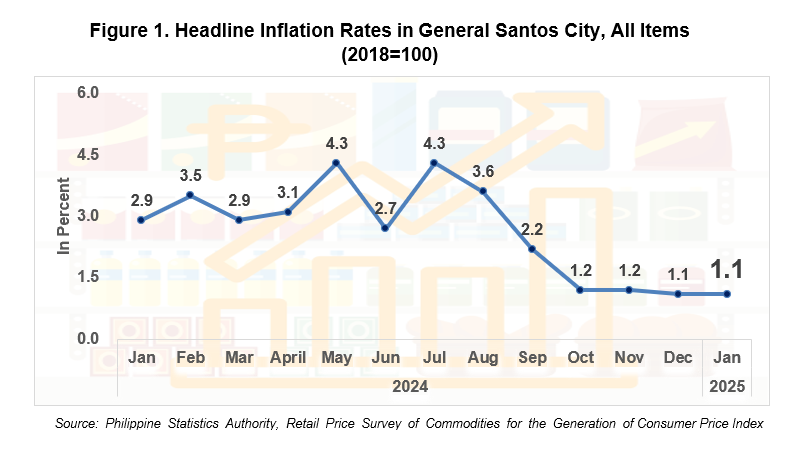
The General Santos City’s headline inflation remained at 1.1 percent in January 2025, the same annual growth rate recorded in December 2024. In January 2024, the inflation rate was higher at 2.9 percent. (Table A and Figure 1)
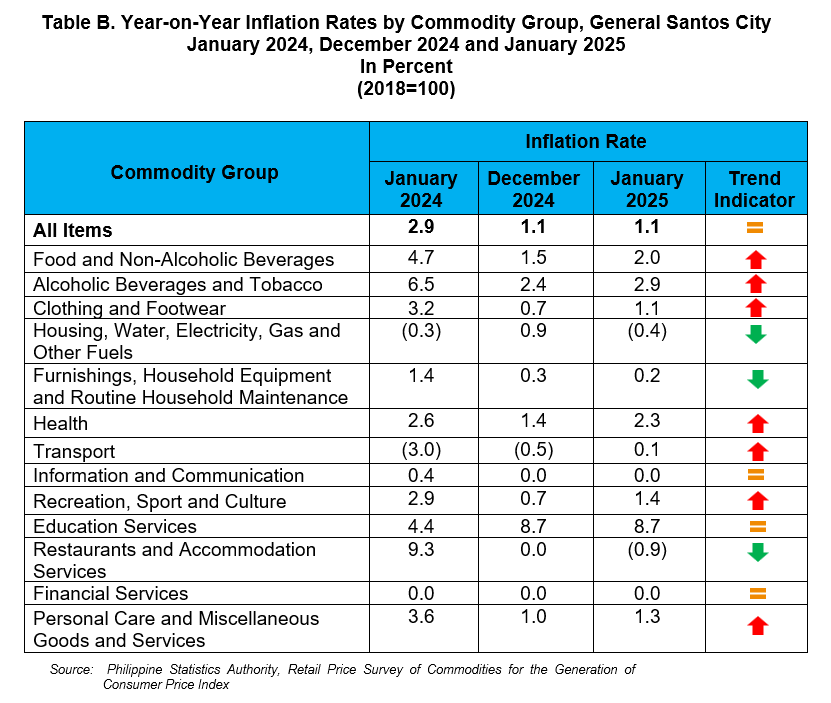
1.1 Main Drivers to the Overall Inflation (Table B)
Faster annual increases were observed in the indices of the following commodity groups during the month:
a. Food and non-alcoholic beverages, 2.0 percent from 1.5 percent;
b. Alcoholic beverages and tobacco, 2.9 percent from 2.4 percent;
c. Clothing and footwear, 1.1 percent from 0.7 percent;
d. Health, 2.3 percent from 1.4 percent;
e. Transport, 0.1 percent from -0.5 percent;
f. Recreation, sport and culture, 1.4 percent from 0.7 percent; and
g. Personal care and miscellaneous goods and services, 1.3 percent from 1.0 percent.
On the contrary, the following major commodity groups registered lower inflation rates during the month:
a. Housing, water, electricity, gas and other fuels, -0.4 percent from 0.9 percent;
b. Furnishings, household equipment and routine household maintenance, 0.2 percent from 0.3 percent; and
c. Restaurants and accommodation services, -0.9 percent from 0.0 percent.
Meanwhile, the following were the commodity groups that remained at their respective previous month’s annual rates:
a. Information and communication, at 0.0 percent;
b. Education services, at 8.7 percent; and
c. Financial services, at 0.0 percent.
1.2 Main Contributors to the January 2025 Overall Inflation
The food and non-alcoholic beverages, which registered an inflation rate of 2.0 percent in January 2025, contributed 71.2 percent or 0.8 percentage point to the overall inflation during the month.
Other main contributors to the January 2025 inflation were the following:
a. Education services with 17.9 percent share or 0.2 percentage point; and
b. Health with 7.5 percent share or 0.1 percentage point.
2. Food Inflation
Food inflation in General Santos City rose to 2.0 percent in January 2025 from 1.5 percent in December 2024. In January 2024, food inflation was higher at 4.8 percent.
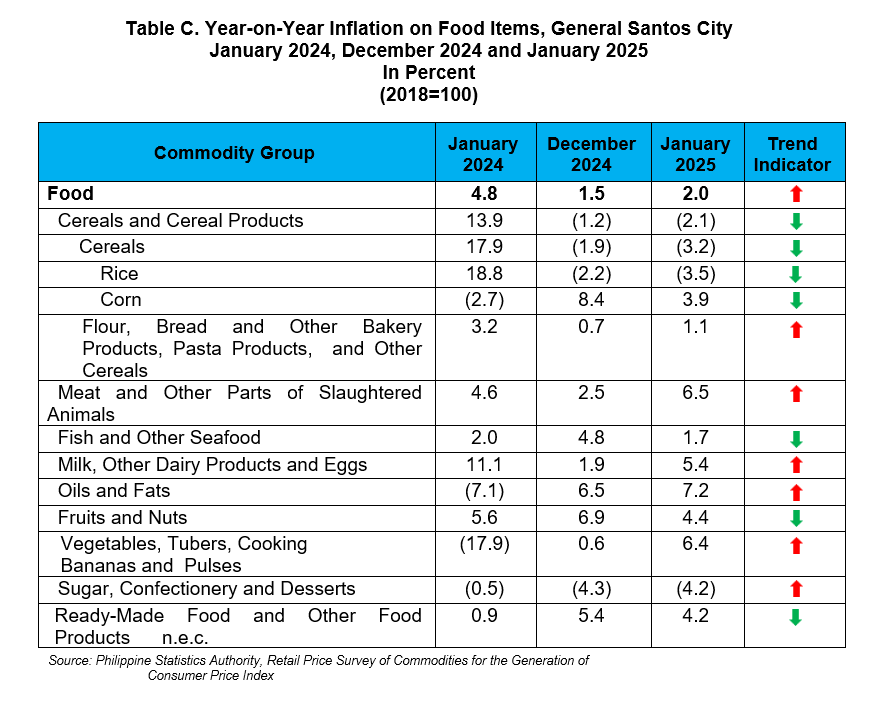
2.1 Main Drivers to the Upward Trend of the Food Inflation (Table C)
The acceleration of food inflation in January 2025 was due to faster annual growth rates of meat and other parts of slaughtered land animals at 6.5 percent from 2.5 percent in December 2024. Also, the index of vegetables, tubers, plantains, cooking bananas and pulses increased to 6.4 percent in January 2025 from 0.6 percent in the previous month. The index of milk, other dairy products and eggs also contributed to the uptrend at 5.4 percent during the month from 1.9 percent in December 2024.
Moreover, flour, bread and other bakery products, pasta products, and other cereals contributed faster annual growth rate of 1.1 percent in January 2025 from 0.7 percent in the previous month. Also, oils and fats recorded faster annual growth rate at 7.2 percent from 6.5 percent in December 2024, while the index of sugar, confectionery and dessert showed a slower year-on-year decline of 4.2 percent in January 2025 from a 4.3 percent annual decrease in the previous month.
In contrast, lower annual growth rates were noted in the indices of the following food groups during the month:
a. Corn, 3.9 percent from 8.4 percent;
b. Fish and other seafood, 1.7 percent from 4.8 percent;
c. Fruits and nuts, 4.4 percent from 6.9 percent; and
d. Ready-made food and other food products n.e.c., 4.2 percent from 5.4 percent.
The index of rice registered an annual decline of 3.5 percent during the month from a 2.2 percent annual decrement in December 2024.
2.2 Main Contributors to the Food Inflation
Food inflation contributed 65.9 percent or 0.7 percentage point to the January 2025 overall inflation. The top three food groups in terms of contribution to the food inflation during the month were the following:
a. Meat and other parts of slaughtered land animals with a share of 57.1 percent or 1.1 percentage point;
b. Milk, other dairy products and egg with a share of 27.9 percent or 0.6 percentage point; and
c. Vegetables, tubers, plantains, cooking bananas and pulses with a share of 27.7 percent or 0.6 percentage point.
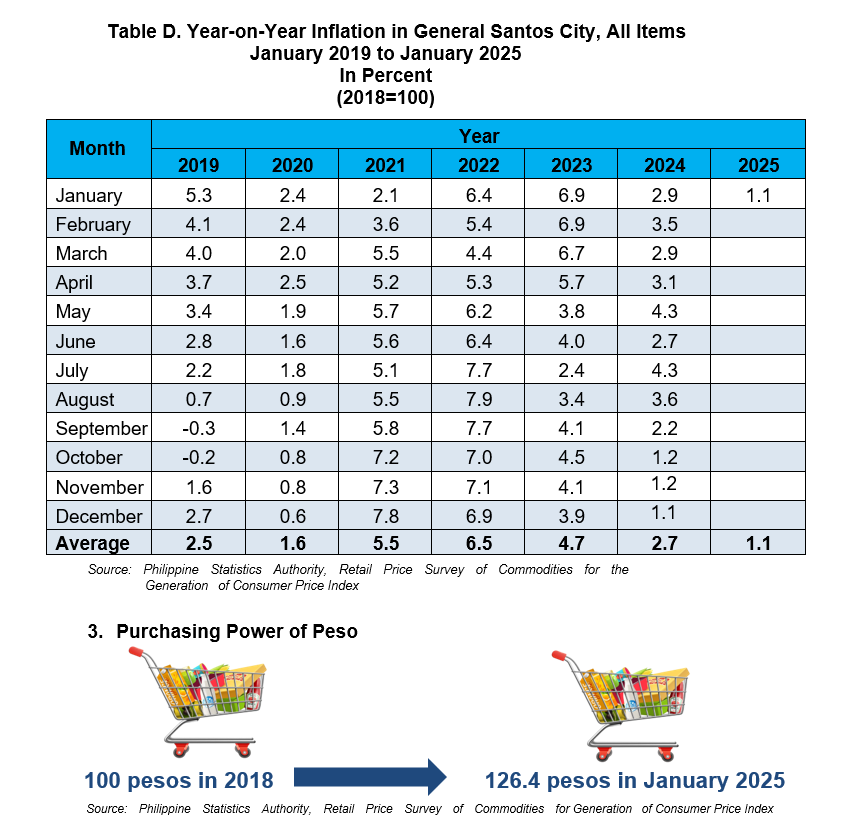
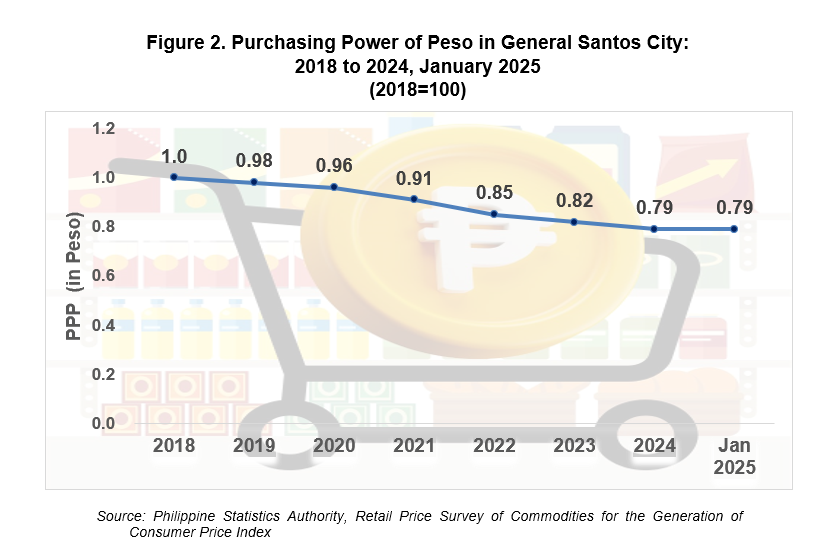
The Purchasing Power of Peso (PPP) in General Santos City remained at PhP 0.79 in January 2025. This means that a peso in 2018 is only worth 79 centavos in January 2025, or you need PhP 126.4 to purchase the same goods and services that cost PhP 100.00 in 2018.
The PPP is inversely related to inflation rate. Therefore, as the inflation rate decreases, PPP inclines. In General Santos City, PPP has been decreasing on the average of 0.04 annually from 2018 to 2024. By comparison, the PPP in 2024 was 0.79 which implies that the PhP 1.00 in 2018 as the base year, values only PhP 0.79 in 2024. (Figure 2)

| Attachment | Size |
|---|---|
|
|
908.64 KB |