

Release Date :
Reference Number :
25R1280-PR-015
YEAR-ON-YEAR INFLATION RATES
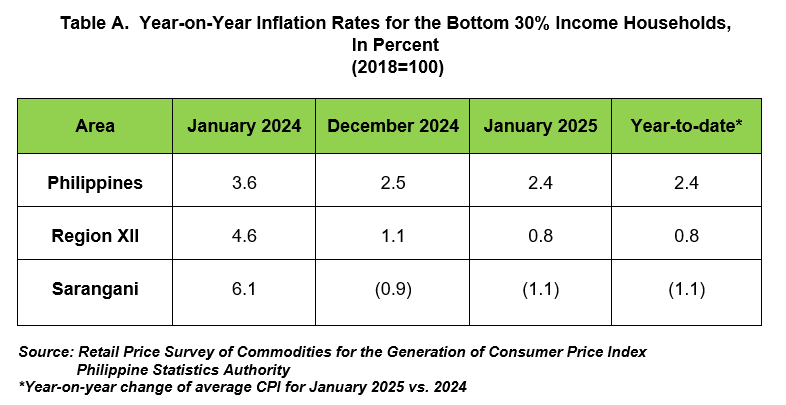
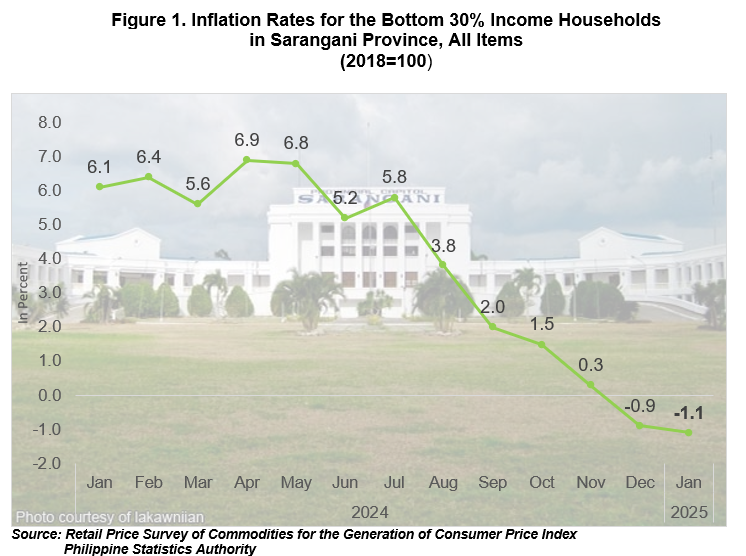
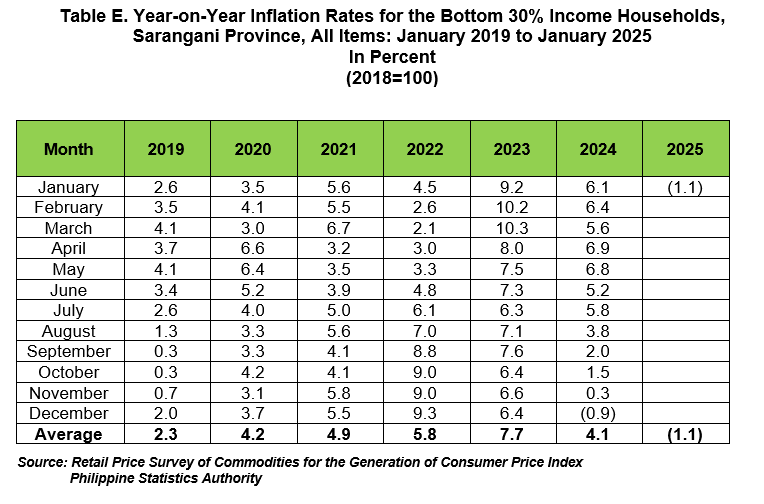
The annual rate of change on the prices of goods and services in the market basket for the bottom 30% income households or the low-income group in Sarangani Province further declined to 1.1 percent in January 2025 from last month’s inflation at -0.9 percent. This was lower than the regional and national levels at 0.8 percent and 2.4 percent, respectively. In January 2024, the inflation rate was posted at 6.1 percent. (Table A and Figure1)
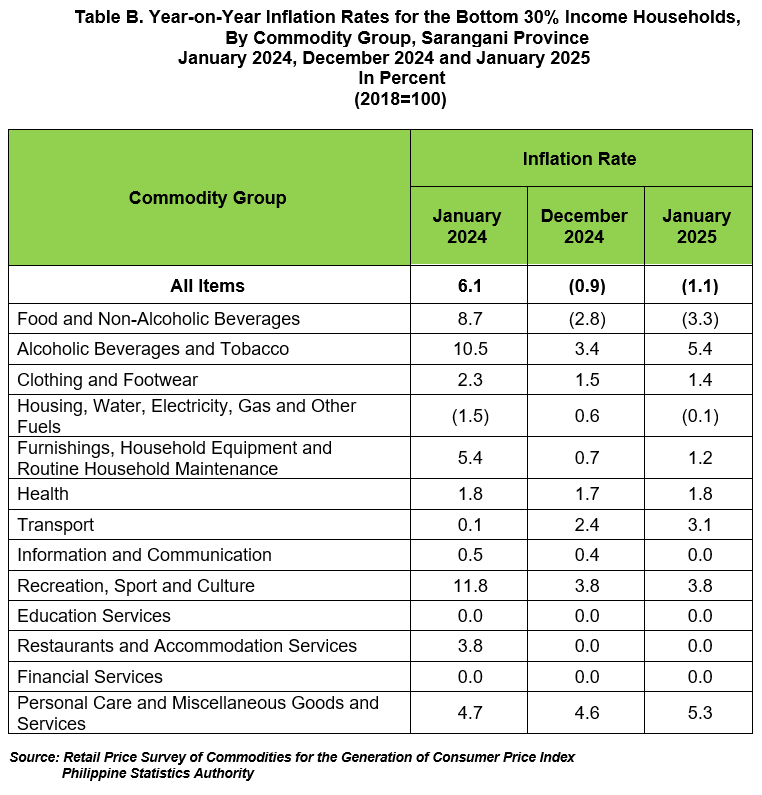
The downtrend in the province’s inflation for the bottom 30% income households in January 2025 was brought about by the faster year-on-year decline in food and non-alcoholic beverages at 3.3 percent from 2.8 percent in the previous month. This was followed by housing, water, electricity, gas and other fuels with -0.1 percent inflation from 0.6 percent in December 2024. Also, information and communication contributed to the downtrend with zero inflation in January 2025 from 0.4 percent inflation in the previous month. Moreover, clothing and footwear also posted a slower annual increase during the month at 1.4 percent inflation from 1.5 percent in December 2024.
On the contrary, the following commodity groups showed higher annual growth rates for the bottom 30% income households during the month:
a) Alcoholic beverages and tobacco, 5.4 percent from 3.4 percent;
b) Furnishings, household equipment and routine household maintenance, 1.2 percent from 0.7 percent;
c) Health, 1.8 percent from 1.7 percent;
d) Transport, 3.1 percent from 2.4 percent; and
e) Personal care and miscellaneous goods and services, 5.3 percent from 4.6 percent. (Table B)
Furthermore, the following commodity groups maintained their previous month’s inflation rates:
a) Recreation, sport and culture, at 3.8 percent;
b) Education services, at zero inflation;
c) Restaurants and accommodation services, at zero inflation; and
d) Financial services, at zero inflation. (Table B)
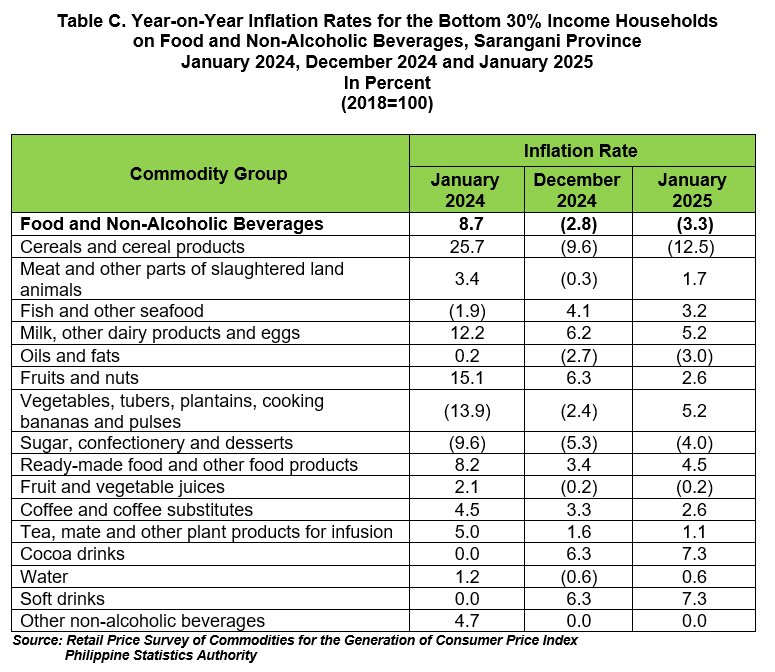
The major contributor to the downtrend in the inflation of food and non-alcoholic beverages was cereals and cereal products at -12.5 percent in January 2025 from -9.6 percent in the previous month with 77.3 percent share. This was followed by fruits and nuts at 2.6 percent in January 2025 from 6.3 percent in the previous month. Also, fish and other seafoods showed a downtrend during the month with 3.2 percent inflation from 4.1 percent in December 2024.
Moreover, the following also contributed to the downtrend inflation of food and non-alcoholic beverages during the month:
a) Milk, other dairy products and eggs, 5.2 percent from 6.2 percent;
b) Oil and fats, -3.0 percent from -2.7 percent;
c) Coffee and coffee substitutes, 2.6 percent from 3.3 percent;
d) Tea, mate and other plant products for infusion, 1.1 percent from 1.6 percent.
(Table C)
Meanwhile, the province’s food inflation for the bottom 30% income households further declined to 3.6 percent in January 2025 from 3.2 percent in December 2024. In January 2024, food inflation for the bottom 30% income households was higher at 9.0 percent. (Table D)
The deceleration of food inflation for the bottom 30% income households in January 2025 was due to the faster price drop of rice with -13.5 percent from -8.8 percent in the previous month. This was followed by fruits and nuts at 2.6 percent inflation during the month from 6.3 percent in December 2024. Also, fish and other seafood contributed to the downtrend with 3.2 percent in January 2025 from 4.1 percent in the previous month. (Table D)
In addition, lower inflation rates were also recorded in the following indices:
a) Corn, -18.7 percent from -17.0 percent;
b) Milk, other dairy products and eggs, 5.2 percent from 6.2 percent;
c) Oil and fats, -3.0 percent from -2.7 percent. (Table D)
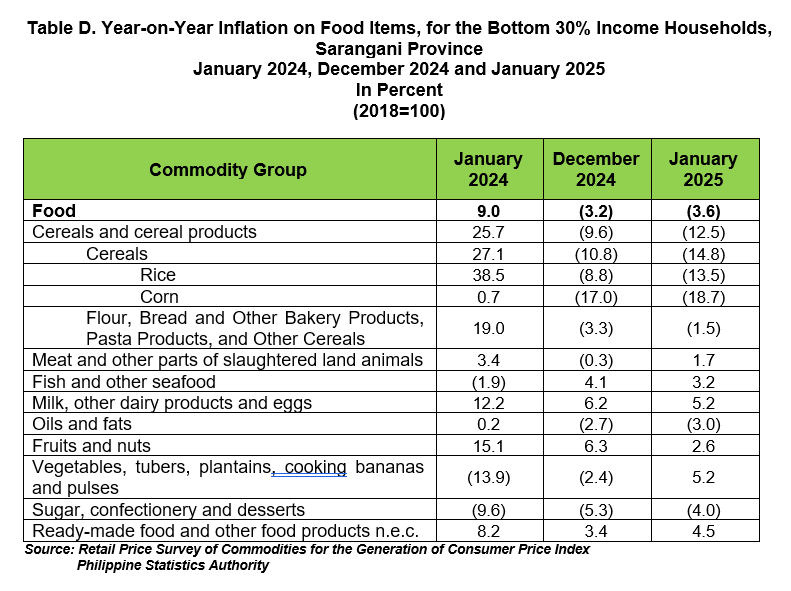
In contrast, the following food groups posted higher annual increases in the bottom 30% income households during the month:
a) Flour, Bread and Other Bakery Products, Pasta Products, and Other Cereals,
-1.5 percent from -3.3 percent;
b) Meat and other parts of slaughtered land animals, 1.7 percent from 0.3 percent;
c) Vegetables, tubers, plantains, cooking bananas and pulses, 5.2 percent from
-2.4 percent;
d) Sugar, confectionery and desserts, -4.0 percent from -5.3 percent;
e) Ready-made food and other food products n.e.c., 4.5 percent from 3.4 percent; (Table D)

| Attachment | Size |
|---|---|
|
|
313.19 KB |