

Release Date :
Reference Number :
2025SR – R1263 -012
YEAR-ON-YEAR INFLATION RATES
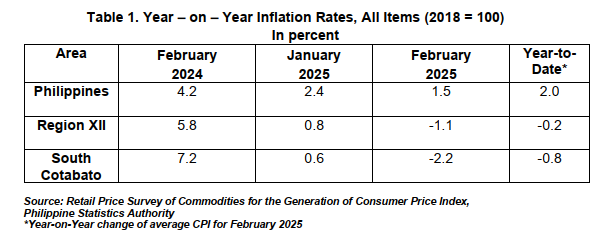
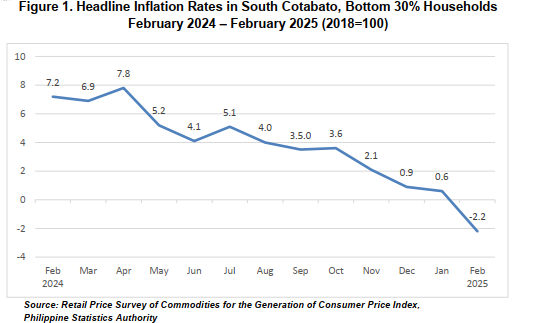
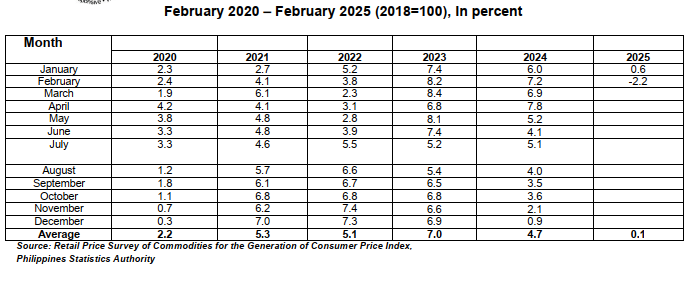
The headline inflation or the annual rate of change on the prices of goods and services in the market basket of South Cotabato decreased to -2.2 percent in February 2025. It was lower by 9.4 percentage points from the same month last year at 7.2 percent and -2.8 percentage point lower from January 2025 at 0.6 percent. South Cotabato’s inflation was lower by -3.7 percentage points compared to the national estimate and -1.1 percentage point lower compared to the regional estimate, respectively. The year-to-date provincial average inflation stood at -0.8 percent (Table 1).
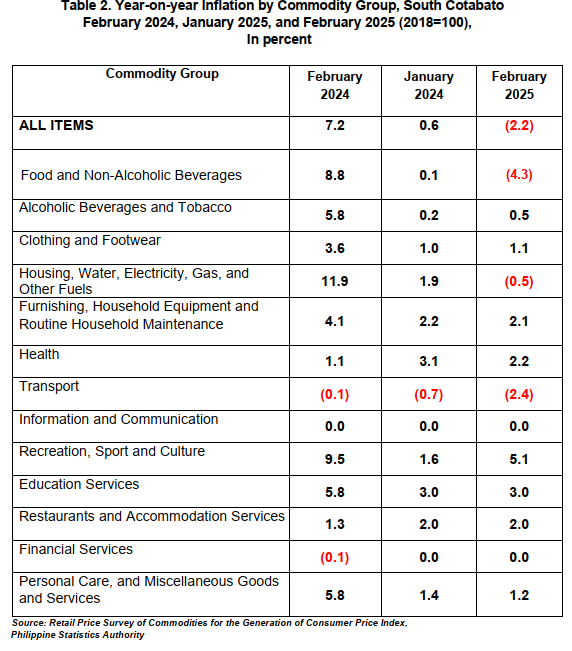
The major contributors to the downtrend in the province’s inflation rate for the month of February 2025 are: Food and Non – Alcoholic Beverages with -4.3 percent inflation; Housing, Water, Electricity, Gas and Other Fuels with -0.5 percent inflation and Transport with -2.4 percent inflation.
Lower annual increments were noted in the indices of the following commodity groups:
a. Food and Non – Alcoholic Beverages, from 0.1% to -4.3%
b. Housing, Water, Electricity, Gas and Other Fuels, from 1.9% to -0.5%
c. Furnishings, Household Equipment and Routine Household Maintenance, from 2.2% to 2.1%
d. Health, from 3.1% to 2.2%
e. Transport, from -0.7% to -2.4%
f. Personal Care, and Miscellaneous Goods and Services, from 1.4% to 1.2%
Meanwhile, higher inflation rates were noted in the following commodity groups:
a. Alcoholic Beverages and Tobacco, from 0.2% to 0.5%
b. Clothing and Footwear, from 1.0% to 1.1%
c. Recreation, Sport and Culture, from 1.6% to 5.1%
The rest of the commodity groups: Information and Communication (0.0%), Education Services (3.0%), Restaurants and Accommodation Services (2.0%) and Financial Services (0.0%) maintained their previous month’s inflation rates. (Table 2)
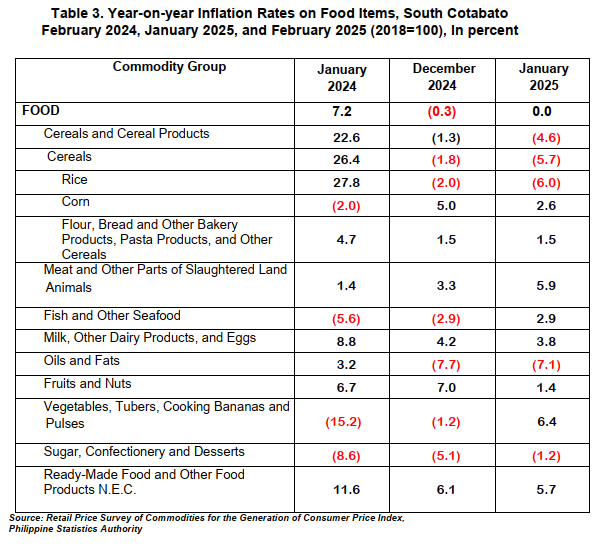
Meanwhile, inflation for food decreased to -4.6 percent in February 2025 from 0.0 percent in January 2025. In February 2024, food inflation was higher at 9.0 percent (Table 3).
The top three food groups that contributed to the decreased in food inflation were Cereals and cereal products at -10.5 percent; Vegetables, tubers, plantains, cooking bananas and pulses at -12.1 percent; and Fish and other seafood at 0.4 percent.
DEFINITION OF TERMS
Base Period/Year this refers to the period, usually a year, at which
the index number/points is set to 100. It is the point of the index number series
Consumer Price Index the average retail prices of a fixed basket of goods
and services commonly purchased by households relative to a base year
Inflation Rate the annual rate of change or the year-on-year change in the CPI expressed in percent
Market basket refers to a sample of goods and services that are commonly purchased and bought by an average Filipino household
Weights a system that considers the relevance of the components of the index
Approved for Release:
MA. EILEEN A. BERDEPRADO
Chief Statistical Specialist
OIC- Provincial Statistics Officer
Philippine Statistics Authority - South Cotabato
For inquiries, please contact:
ANGELIKA MAY A. VARGAS
PPA Statistical Analyst
Philippine Statistics Authority - South Cotabato
Telephone Number (083) 877-1905
| Attachment | Size |
|---|---|
|
|
302.25 KB |