

Release Date :
Reference Number :
2025SR – R1263 -018
YEAR-ON-YEAR INFLATION RATES
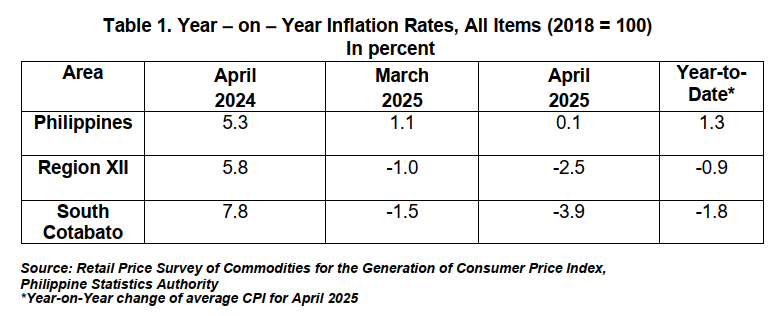
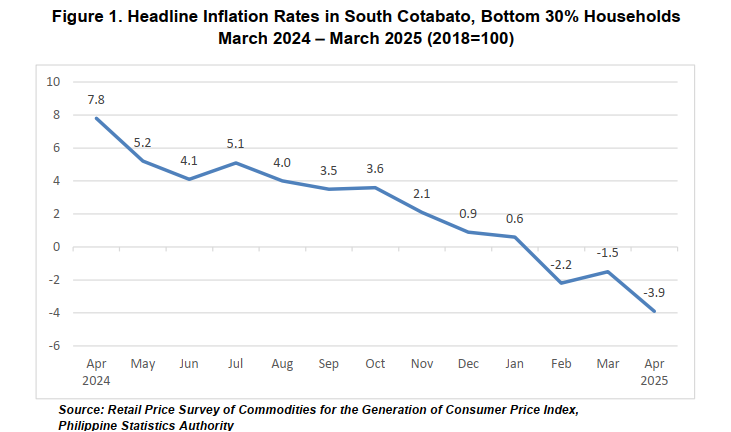
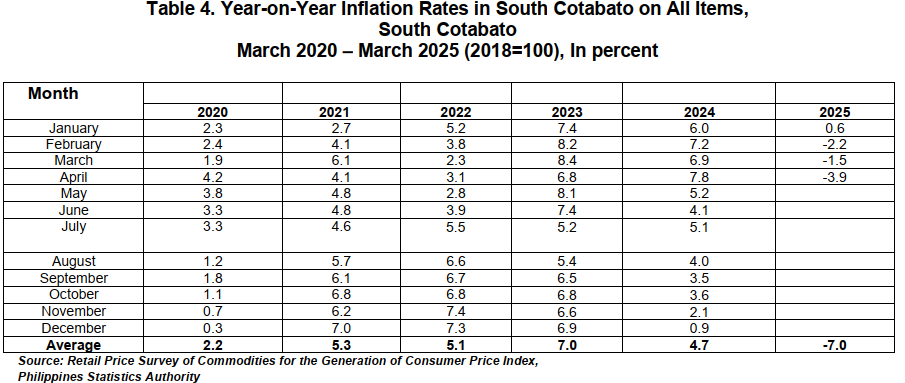
The headline inflation or the annual rate of change on the prices of goods and services in the market basket of South Cotabato decreased to -3.9 percent in April 2025. It was lower by 3.9 percentage points from the same month last year at 7.8 percent and -2.4 percentage point lower from March 2025 at -1.5 percent. South Cotabato’s inflation was lower by -3.8 percentage points compared to the national estimate and -1.4 percentage point lower compared to the regional estimate, respectively. The year-to-date provincial average inflation stood at -1.8 percent (Table 1).
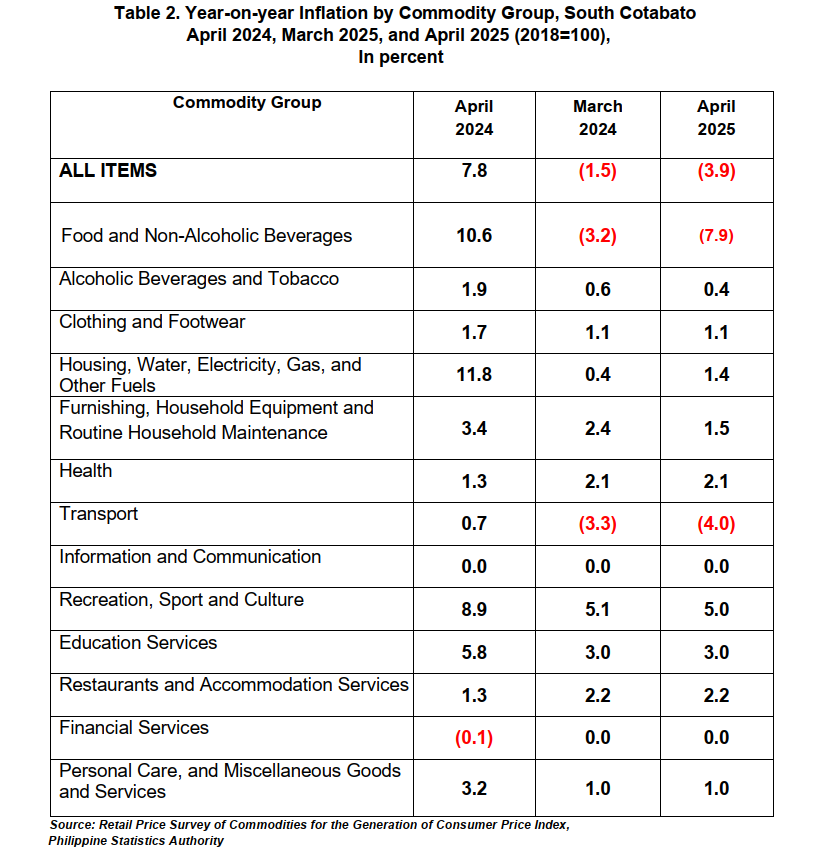
The major contributors to the downtrend in the province’s inflation rate for the month of April 2025 is Food and Non – Alcoholic Beverages with -7.9 percent inflation; Transport with -4.0 percent inflation and Furnishings, Household Equipment and Routine Household Maintenance with 1.5 percent inflation.
Lower annual increments were noted in the indices of the following commodity groups:
a. Food and Non – Alcoholic Beverages, from -3.2% to -7.9%
b. Transport, from -3.3% to -4.0%
c. Furnishings, Household Equipment and Routine Household Maintenance,
from 2.4% to 1.5%
d. Alcoholic Beverages and Tobacco, from 0.6% to 0.4%
e. Recreation, Sport and Culture, from 5.1% to 5.0%
Meanwhile, higher inflation rates were noted in the following commodity groups:
a. Housing, Water, Electricity, Gas and Other Fuels, from 0.4% to 1.4%
The rest of the commodity groups: Clothing and Footwear (1.1%), Health (2.1%), Information and Communication (0.7%), Education Services (3.0%), Restaurants and Accommodation Services (2.2), Financial Services (0.0%) and Personal Care, and Miscellaneous Goods and Services (1.0%) maintained their previous month’s inflation rates. (Table 2)
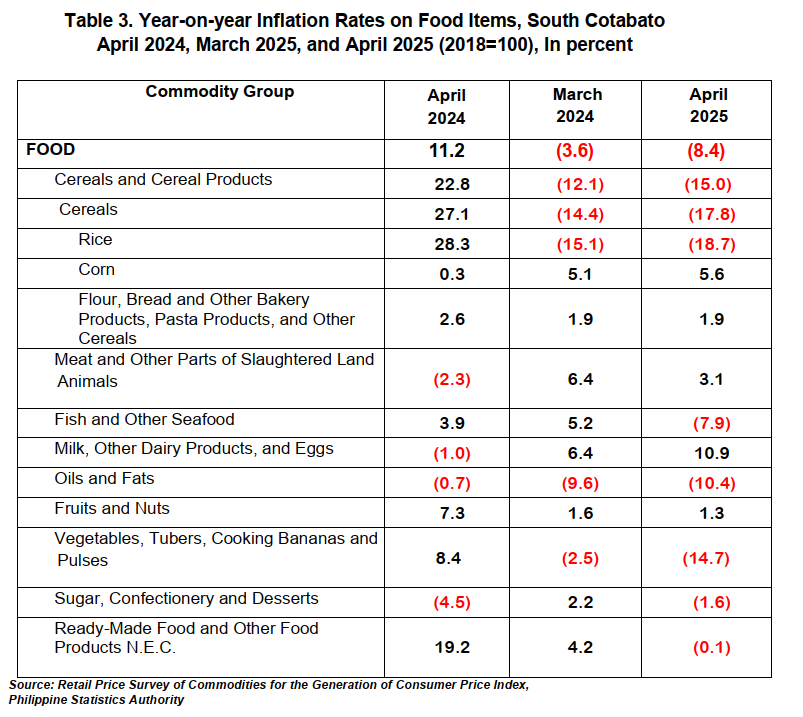
Meanwhile, inflation for food decreased to -8.4 percent in April 2025 from -3.6 percent in March 2025. In March 2024, food inflation was higher at 11.2 percent (Table 3).
The top three food groups that contributed to the decreased in food inflation were; Fish and other seafood (ND), -7.9 percent; Cereals and cereal products (ND), -15.0 percent and Vegetables, tubers, plantains, cooking bananas and pulses (ND), -14.7 percent.
DEFINITION OF TERMS
Base Period/Year this refers to the period, usually a year, at which
the index number/points is set to 100. It is the point of the index number series
Consumer Price Index the average retail prices of a fixed basket of goods
and services commonly purchased by households relative to a base year
Inflation Rate the annual rate of change or the year-on-year change in the CPI expressed in percent
Market basket refers to a sample of goods and services that are commonly purchased and bought by an average Filipino household
Weights a system that considers the relevance of the components of the index
Approved for Release:
MA. EILEEN A. BERDEPRADO
Chief Statistical Specialist
OIC- Provincial Statistics Officer
Philippine Statistics Authority - South Cotabato
For inquiries, please contact:
ANGELIKA MAY A. VARGAS
PPA Statistical Analyst
Philippine Statistics Authority - South Cotabato
Telephone Number (083) 877-1905
| Attachment | Size |
|---|---|
|
|
301.94 KB |