

Release Date :
Reference Number :
R12-SR2025-004
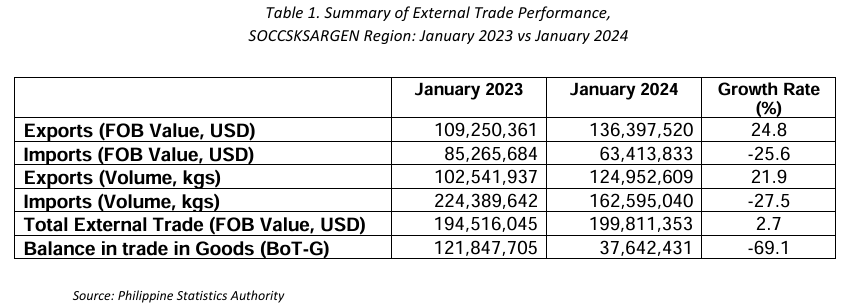
Total external trade up by 2.7 percent
The SOCCSKSARGEN Region's external trade in products in January 2024 increased by 2.7 percent at US$199.811 million from US$194.516 million in January 2023. (Table 1).
Trade balance decreased by 69.1 percent
Balance of trade in goods (BoT-G) is the difference between the value of exports and imports. The BoT-G amounted to US$37.642 million in January 2024, an increase of 69.1 percent from US$121.848 million recorded in January 2023. (Table 1).
Merchandise Trade
The total export value increased by 24.8 percent to US$136.397 million in January 2024 from US$109.250 million in January 2023. The volume of exports summed up to 124.593 million kilograms in January 2024 from 102.542 million kilograms the previous year. The value of imports were down by 25.6 percent to US$63.414 million in January 2024 from US$85.266 million in January 2023. Imports volume were up to 162.595 million kilograms in January 2024 from 224.390 million kilograms in January 2023.
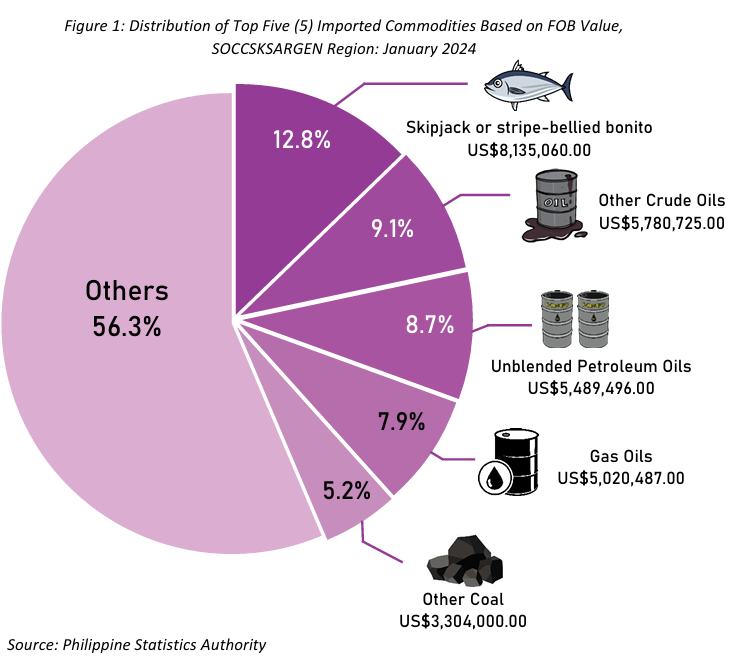
Skipjack or stripe-bellied bonito was the top import commodity
The top import commodity of the region was Skipjack or stripe-bellied bonito at US$8.135 million accounting for 12.8 percent of the region’s overall import value. Followed by Other crude oils at US$5.781 million (9.1%), Unblended petroleum oils with US$5.489 million (8.7%), Gas Oils with US$5.020 million (7.9%), and Other coal with US$3.304 million (5.2%). (Figure 1)
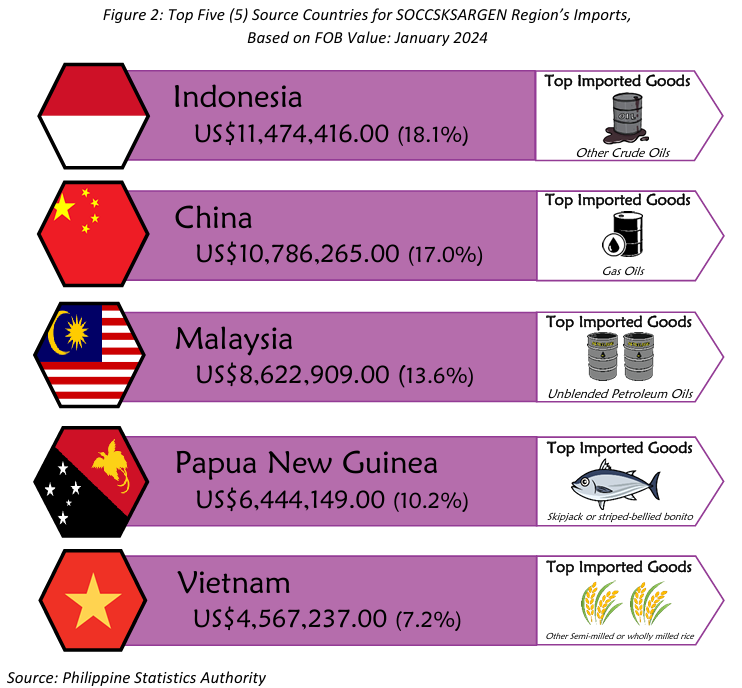
Indonesia was the largest source of import goods
Indonesia was the region's largest importer with US$11.474 million accounting for 18.1 percent of total imports of the region. Followed by China with US$10.786 million (17.0%), Malaysia with US$8.623 million (13.6%), Papua New Guinea with US$6.444 million (10.2%), and Vietnam with US$4.567 million (7.2%).
Other Crude Oils was the leading imports from Indonesia; Gas Oils in China; Unblended Petroleum Oils in Indonesia; Skipjack or striped-bellied bonito in Papua New Guinea; and Other semi-milled or wholly milled rice in Vietnam. (Figure 2)
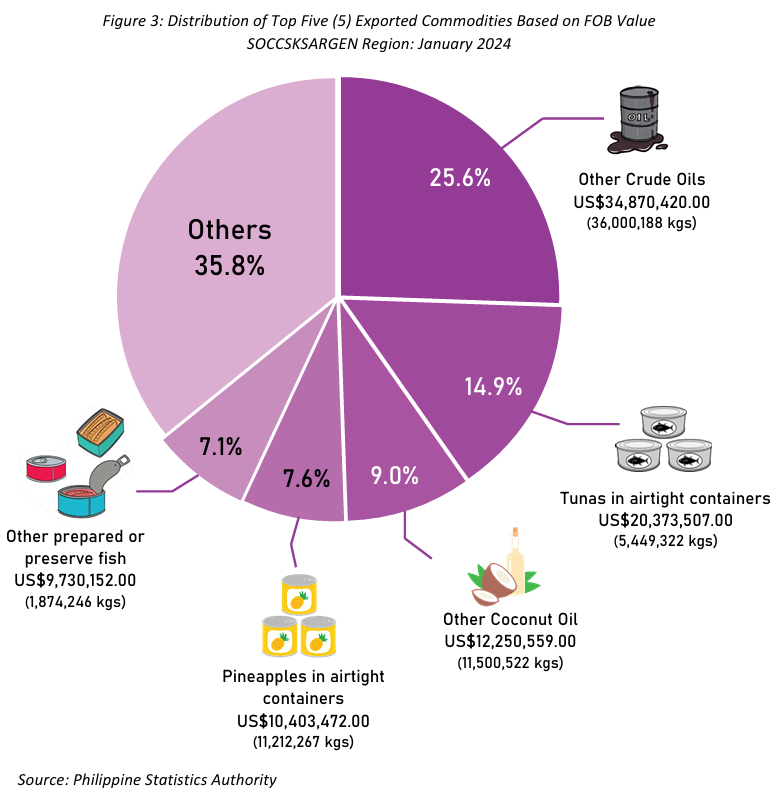
Other Crude Oils were the top export goods
Other Crude Oils, Tunas in airtight containers, Other Coconut Oil, Pineapples in airtight containers, and Other prepared or preserve fish were the top five export goods in terms of FOB Value. Other Crude Oils were valued at US$34.870 million (25.6%), Tunas in airtight containers, US$20.374 million (14.9%); Other coconut oil at US$12.251 million (9.0%); Pineapples in airtight containers at US$10.403 million (7.6%); and Other preserved or prepared fish, US$9.730 million (7.1%). (Figure 3)
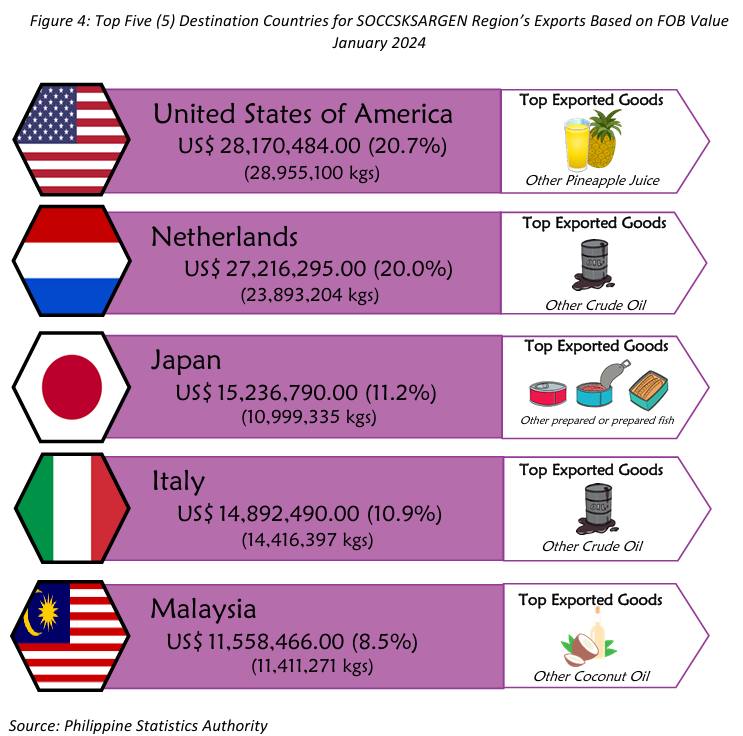
The United States of America was the top export commodity destination
The United States of America were the region's top export market with US$28.170 million accounting for 20.7 percent of the total export value. Following it was the Netherlands with US$27.216 million (20.0%), Japan with US$15.237 million (11.2%), Italy with US$14.892 million (10.9%), and Malaysia with US$11.558 million (8.5%).
Other Pineapple Juice in United States of America, Other Crude Oil was the top exports in Netherlands and Italy, Other Crude Oil in Japan, and Other coconut oils in Malaysia. (Figure 4).
| Attachment | Size |
|---|---|
|
|
690.52 KB |