

Release Date :
Reference Number :
R12-SR2025-012
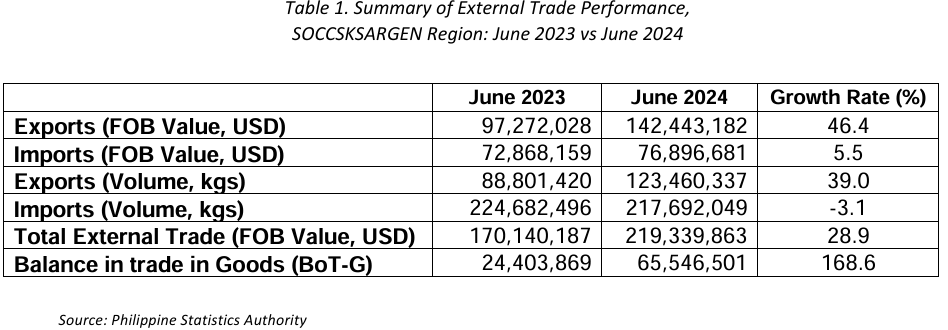
Total external trade up by 28.9 percent
The SOCCSKSARGEN Region's external trade in products in June 2024 increased by 28.9 percent at US$219.340 million from US$170.140 million in June 2023 (Table 1).
Trade balance increased by 168.6 percent
Balance of trade in goods (BoT-G) is the difference between the value of exports and imports. The BoT-G amounted to US$65.547 million in June 2024, increasing by 168.6 percent from US$24.404 million recorded in June 2023 (Table 1).
Merchandise Trade
Export value went up by 46.4 percent to US$142.443 million in June 2024 from US$97.272 million in June 2023. The volume of exports totaled to 123.460 million kilograms in June 2024 from 88.801 million kilograms the previous year. The value of imports increased by 5.5 percent to US$76.897 million in June 2024 from US$72.868 million in June 2023. Imports volume were down to 217.692 million kilograms in June 2024 from 224.682 million kilograms in June 2023 (Table 1).
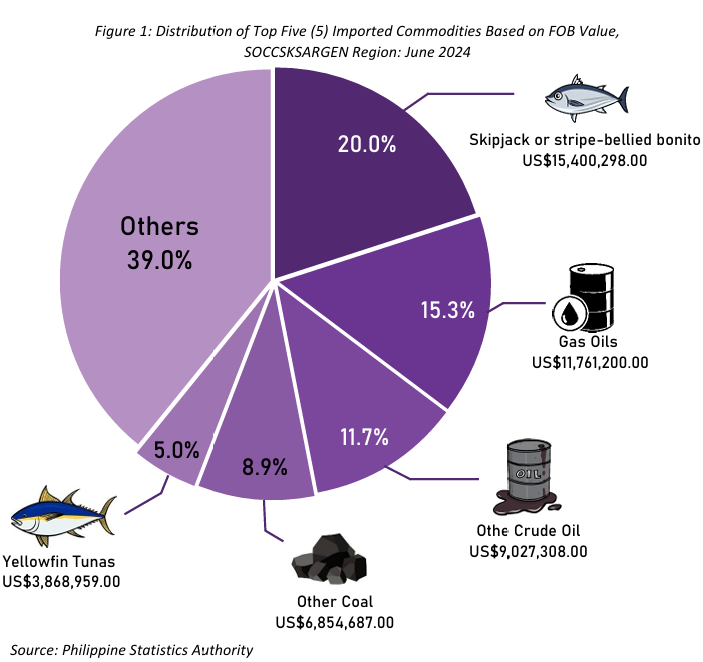
Skipjack or stripe-bellied bonito was the top import commodity
The top import commodity of the region was Skipjack or stripe bellied bonito at US$15.400 million accounting for 20.0 percent of the region’s overall import value. Followed by Gas Oils with US$11.761 million (15.3%), Other Crude Oils at US$9.027 million (11.7%), Other coal with US$6.855 million (8.9%), and Yellowfin Tunas with US$3.869 million (5.0%) (Figure 1).
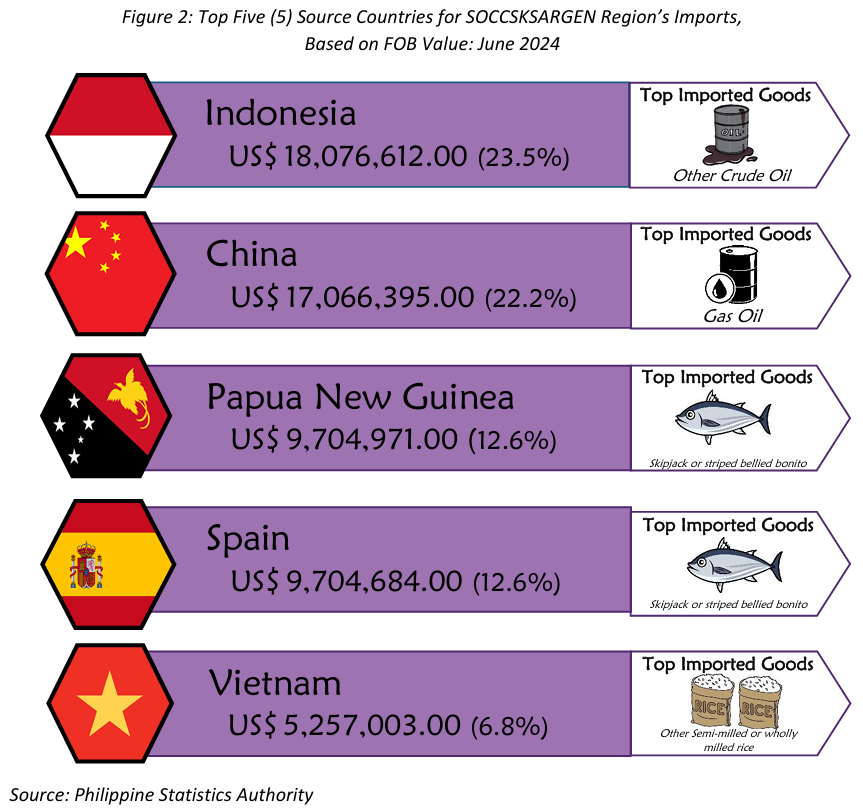
Indonesia was the largest source of import goods
Indonesia was the region's largest importer with US$18.077 million accounting for 23.5 percent of total imports of the region. Followed by China with US$17.006 million (22.2%), Papua New Guinea with US$9.705 million (12.6%), Spain with US$9.705 million (12.6%), and Vietnam with US$5.257 million (6.8%).
Other Crude Oil was the leading imports from Indonesia, Gas Oils in China, Skipjack or striped bellied bonito from Papua New Guinea and Spain; and Other semi-milled or wholly milled rice from Vietnam. (Figure 2)
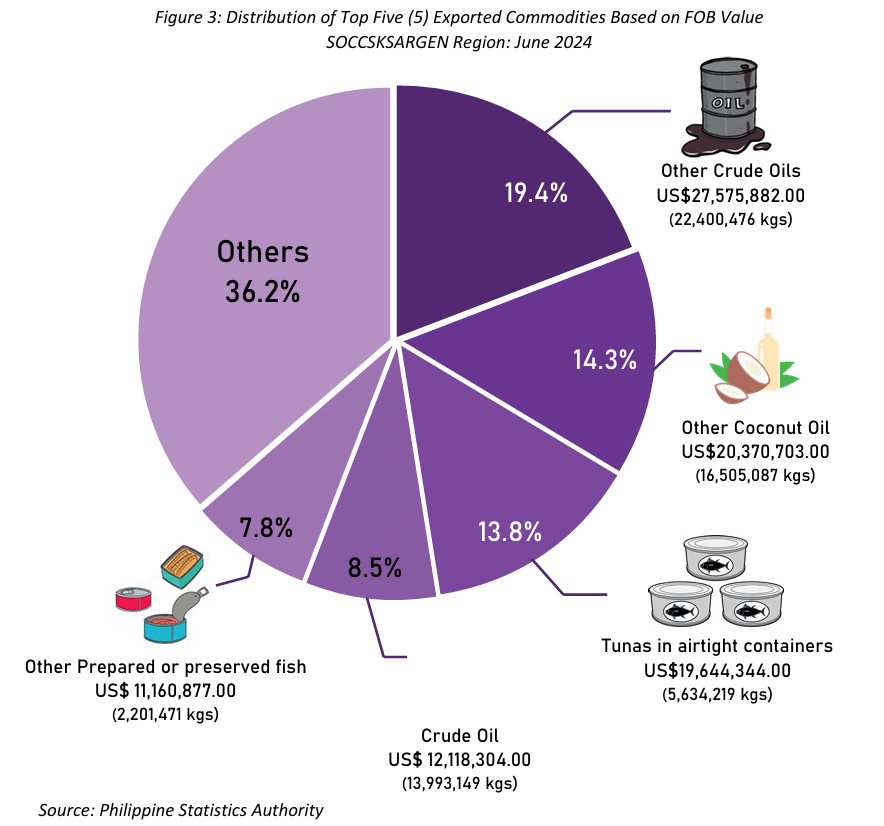
Other Crude Oils were the top export goods
Other crude oils, Other coconut oil, Tunas in airtight containers, Crude Oil, and Other prepared or preserved fish were the top five export goods in terms of FOB Value. Other crude oils were valued at US$27.576 million (19.4%); Other coconut oil at US$20.370 million (14.3%); Tunas in airtight containers at US$19.644 million (13.8%); Crude Oil at US$12.118 million (8.5%); and Other prepared or preserved fish at US$11.161 million (7.8%). (Figure 3)
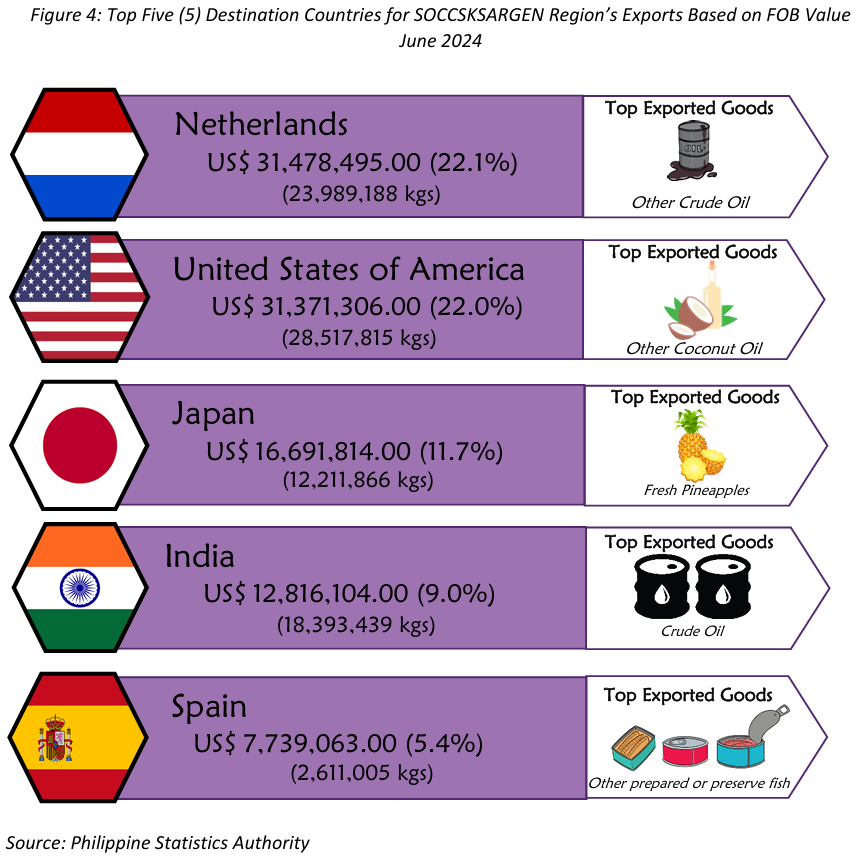
Netherlands was the top export commodity destination
The region's top export market was the Netherlands with US$31.478 million accounting for 22.1 percent of the total export value. Following it was the United States of America with US$31.371 million (22.0%), Japan with US$16.692 million (11.7%), India with US$12.816 million (9.0%), and Spain with US$7.739 million (5.4%).
Other crude oil was the top exports in Netherlands, Other coconut oil in United States of America, Fresh Pineapples in Japan, Crude oil in India, and Other prepared or preserved fish in Spain. (Figure 4).
Approved for Release:
(SGD.)
ATTY. MAQTAHAR L. MANULON, CESO V
Regional Director
For inquiries, please contact:
SITTIMAZUIN M. HOFILEÑA/NORJAHNA M. HADJINOR-DISCAYA
Statistical Operations and Coordination Division, PSA-RSSO XII
Telephone Number (083) 825-2830
| Attachment | Size |
|---|---|
|
|
667.64 KB |