

Release Date :
Reference Number :
65R12-SR2024-31
Table 1. Year-on-Year Headline Inflation Rates, All Items
in Percent
(2018=100)
Inflation in Sultan Kudarat Province
1. Headline Inflation
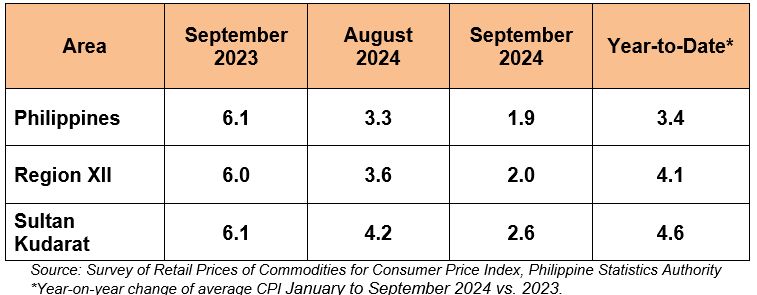
The inflation rate or the year-on-year change on the prices of goods and services commonly purchased by people in the province of Sultan Kudarat continue to slow down to 2.6 percent in September 2024 compared to 4.2 percent recorded in August 2024. This brings the provincial average inflation from January to September 2024 at 4.6 percent. (Table 1, Table 2 and Figure 1)
Figure 1: Inflation Rate in Sultan Kudarat Province, All Items
September 2023 to September 2024
(2018=100)
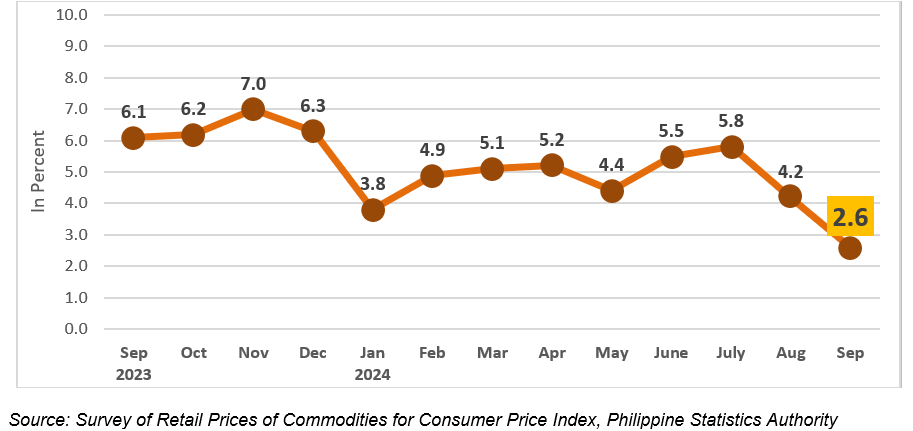
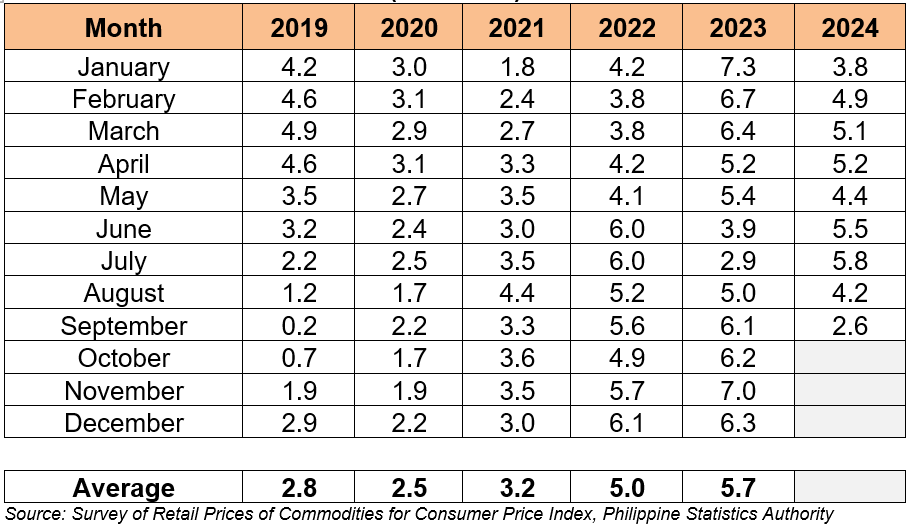
Table 2. Year-on-Year Inflation Rates, Sultan Kudarat Province in Percent
January 2019 – September 2024
(2018=100)
1.1. Main Drivers to the Downtrend of the Headline Inflation
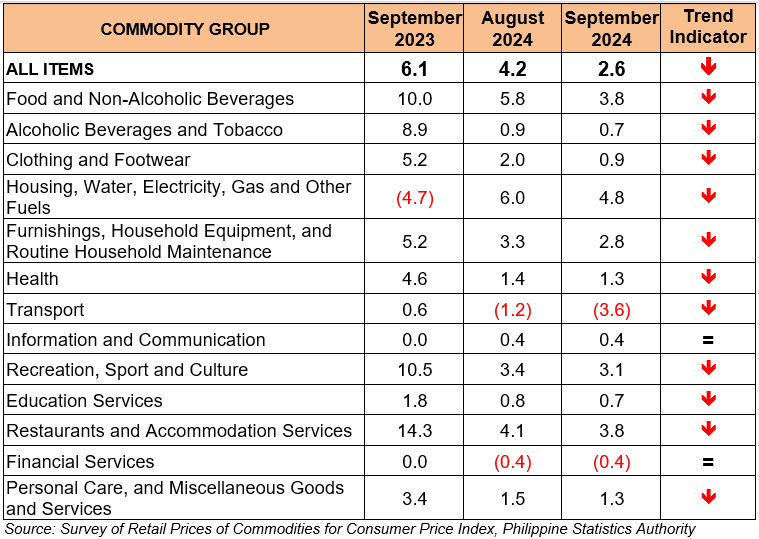
The downtrend in the overall inflation in September 2024 was primarily influenced by the lower annual growth rate in the index of Food and Non-Alcoholic Beverages at 3.8 percent inflation compared to 5.8 percent in August 2024. This was followed by, Transport at -3.6 percent deflation compared to -1.2 percent deflation in August 2024 and, Housing, Water, Electricity, Gas and Other Fuels at 4.8 percent compared to 6.0 percent in August 2024.
The following commodity groups also contributed to the downward trend of inflation during the month compared to August 2024 annual rates:
a. Alcoholic Beverages and Tobacco at 0.7 percent from 0.9 percent;
b. Clothing and Footwear at 0.9 Percent from 2.0 percent;
c. Furnishings, Household Equipment and Routine Household Maintenance at 2.8 percent from 3.3 percent;
d. Health at 1.3 percent from 1.4 percent;
e. Recreation, sport and Culture at 3.1 percent from 3.4 percent;
f. Education Services at 0.7 percent from 0.8 percent;
g. Restaurants and Accommodation Services at 3.8 percent from 4.1 percent; and
h. Personal Care, and Miscellaneous Goods and Services, at 1.3 percent from 1.5 percent.
Meanwhile, the indices of the rest of the commodity groups retained their respective previous month’s inflation rate (Table 3)
Table 3. Year-on-Year Inflation by Commodity Groups,
Sultan Kudarat Province in Percent,
September 2023, August 2024, and September 2024
(2018=100)
1.2 Main Contributors to the Headline Inflation
The top three commodity groups contributing to the September 2024 headline inflation were the following:
a. Food and Non-Alcoholic Beverages with 66.2 percent share or 1.72 percentage points.
b. Housing, Water, Electricity, Gas and Other Fuels with 26.2 percent share or 0.68 percentage point; and
c. Restaurants and Accommodation Services with 9.0 percent share or 0.23 percentage point.
2. Food Inflation
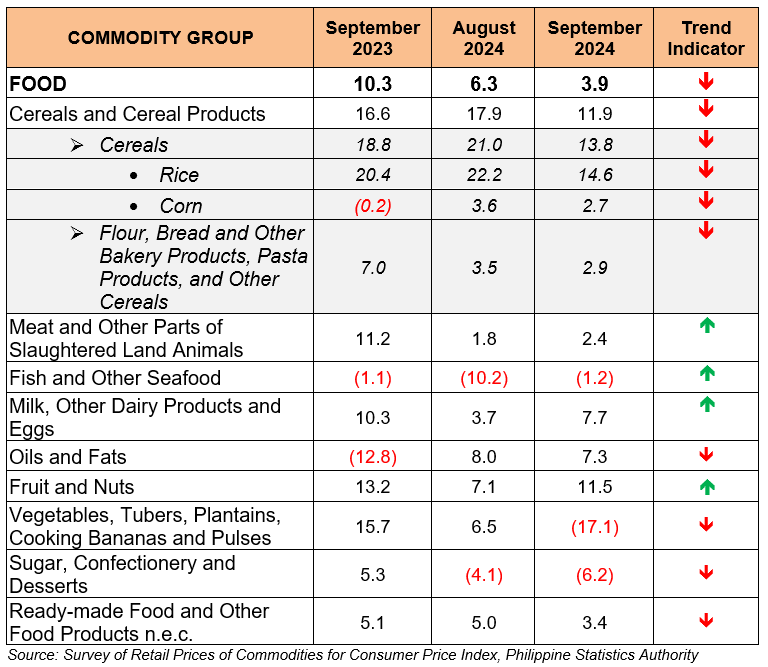
Food Inflation, likewise, slowed down to 3.9 percent inflation compared to 6.3 percent reported in August 2024, in September 2023 food inflation was higher at 10.3 percent.
The following food groups showed lower inflation during the month.
a. Cereals, at 13.8 percent compared to 21.0 percent,
b. Flour, Bread and Other Bakery Products, Pasta Products, and Other Cereals, at 2.9 percent compared to 3.5 percent,
c. Oils and Fats at 7.3 percent compared to 8.0 percent, and
d. Ready-made food and other food products n.e.c. at 3.4 percent compared to 5.0 percent.
In contrast, three food groups showed higher inflation during the month.
a. Meat and other parts of slaughtered land animals at 2.4 percent compared to 1.8 percent,
b. Milk, other dairy products and eggs, at 7.7 percent compared to 3.7 percent,
c. Fruits and Nuts at 11.5 percent compared to 7.1 percent.
Meanwhile, three food groups showed deflation during the month.
a) Fish and other seafood at -1.2 percent deflation,
b) Vegetables, tubers, plantains, cooking bananas and pulses, at -17.1 percent deflation, and
c) Sugar, confectionery and desserts at -6.2 percent deflation. (Table 4)
Table 4. Year-on-Year Inflation on Food Items
Sultan Kudarat Province, in Percent,
September 2023, August 2024, and September 2024
(2018=100)
Main Contributors to the Food Inflation
The food groups with the highest contribution to food inflation during the month were the following:
a. Cereals and Cereals Products with 107.6 percent share or 4.20 percentage points.
b. Milk, other dairy products and eggs with 10.6 percent share or 0.41 percentage points; and
c. Fruits and nuts with 9.4 percent share or 0.36 percentage points.
Purchasing Power of Peso
The Purchasing Power of Peso (PPP) measures the current value of the peso in reference to its value in the base year. It has an inverse relationship with the Consumer Price Index (CPI), which means that if the CPI increases, the PPP decreases.
Table 5. Purchasing Power of Peso (PPP) in Sultan Kudarat Province
January to December - 2018, 2019, 2020, 2021, 2022, 2023
and January to September 2024
(2018=100)
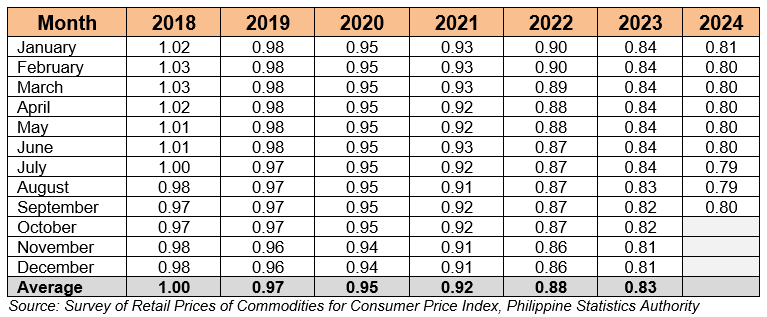
Table 6. Consumer Price Index (CPI) in Sultan Kudarat Province
January to September 2024
(2018=100)
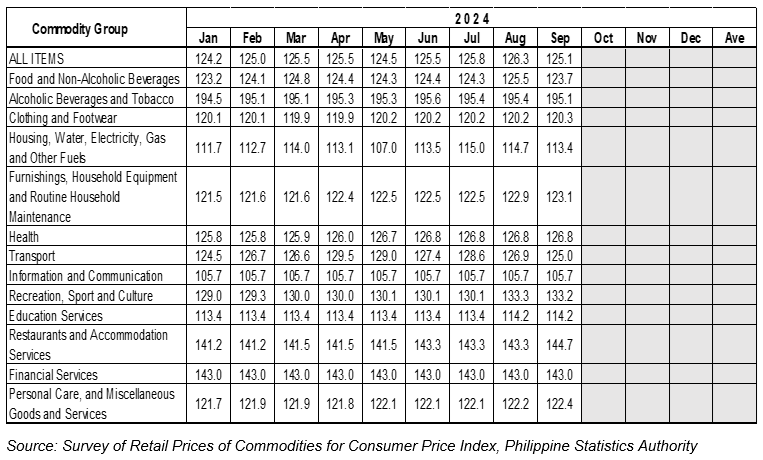
Figure 2: Purchasing Power of Peso (PPP)
2018, 2019, 2020, 2021, 2022, 2023 and September 2024
(2018=100)
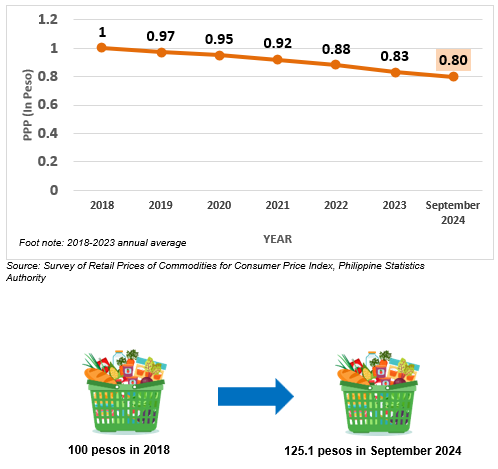
Table 5, Table 6 and Figure 2. showed that the PPP for the province of Sultan Kudarat dropped to PhP 0.80 in September 2024 from PhP 1.00 in 2018.
This means that the peso in 2018 is only worth 80 centavos in September 2024, or an average Sultan Kudarateños household need PhP 125.10 to purchase the same volume of goods and services worth P100.00 in 2018.
Approved for Release:

HERLITA G. CARAAN
Chief Statistical Specialist
| Attachment | Size |
|---|---|
|
|
444.57 KB |