

Release Date :
Reference Number :
24R1280-PR-052
YEAR-ON-YEAR INFLATION RATES
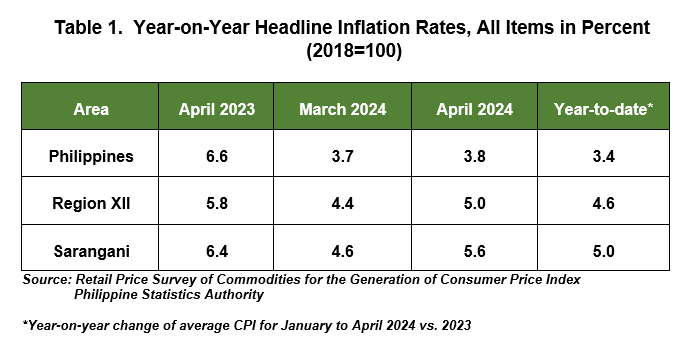
The headline inflation in Sarangani quickened to 5.6 percent in April 2024 from 4.6 percent in March 2024. This is higher than the regional and national levels at 5.0 percent and 3.8 percent, respectively. In April of the previous year, inflation was higher at 6.4 percent. Inflation for the first four months of the year averaged at 5.0 percent. (Table 1 and Figure 1).
The acceleration in the province’s inflation rate in April 2024 was primarily due to the higher annual growths in the index of food and non-alcoholic beverages restaurants at 9.4 percent from 7.3 percent inflation in March 2024. This was followed by transport at 5.1 percent from 2.7 percent and, personal care, and miscellaneous goods and services at 4.2 percent from 3.6 percent in March 2024. (Table 2)
Also contributed to the upward trend are the following commodity groups:
a. Housing, water, electricity, gas and other fuels, at -1.6 percent from -1.8 percent;
b. Recreation, sport and culture, at 8.5 percent from 7.2 percent; and
c. Health, at 4.4 percent from 3.9 percent. (Table 2)
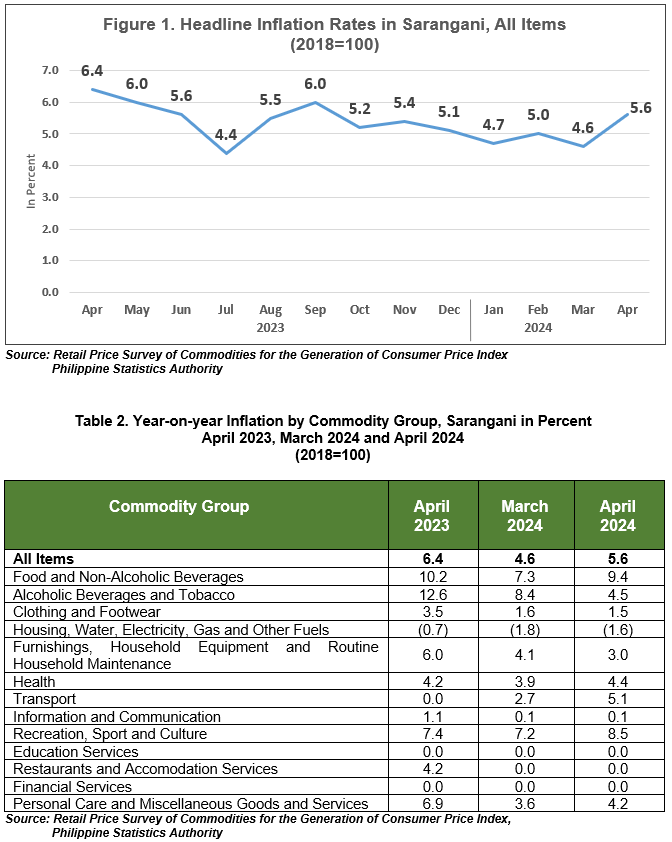
On the contrary, slower annual increases were observed in the indices of alcoholic beverages and tobacco, at 4.5 percent from 8.4 percent in March 2024, clothing and footwear, at 1.5 percent from 1.6 percent and, furnishings, household equipment and routine household maintenance, at 3.0 percent from 4.1 percent in March 2024. The rest of the commodity groups retained their previous month’s annual rates. (Table 2)
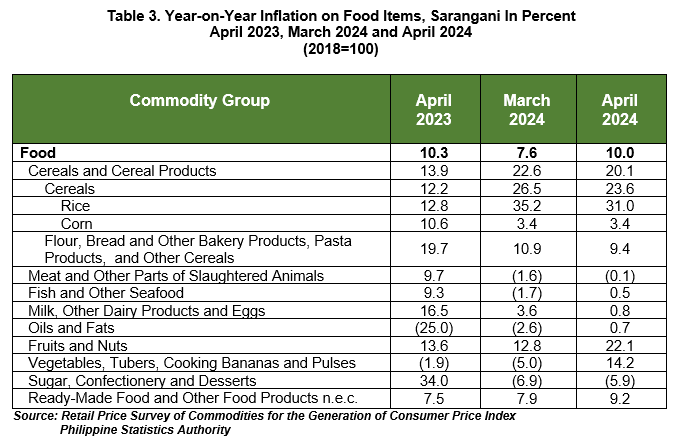
Sarangani’s food inflation increased to 10.0 percent in April 2024 from 7.6 percent in March 2024. In April 2023, food inflation was higher at 10.3 percent. (Table 3)
The top three food groups that contributed to the increase in food inflation were vegetables, tubers, plantains, cooking bananas and pulses at 14.2 percent from 5.0 percent in March 2024, followed by fish and other seafood at 0.5 percent from -1.7 percent and, fruits and nuts at 22.1 percent from 12.8 percent in March 2024. (Table 3)
Higher annual increments were also recorded in the following food groups:
a. Meat and other parts of slaughtered land animal, at -0.1 percent from -1.6 percent;
b. Ready-made food and other food products n.e.c, at 9.2 percent from 7.9 percent;
c. Oils and fats, at 0.7 percent from -2.6 percent; and
d. Sugar, confectionery and desserts, at -5.9 percent from -6.9 percent. (Table 3)
Meanwhile, lower annual increments were noted in the following food groups:
a. Cereal and cereal products, at 20.1 percent from 22.6 percent; and
b. Milk, other dairy products and eggs, at 0.8 percent from 3.6 percent. (Table 3)
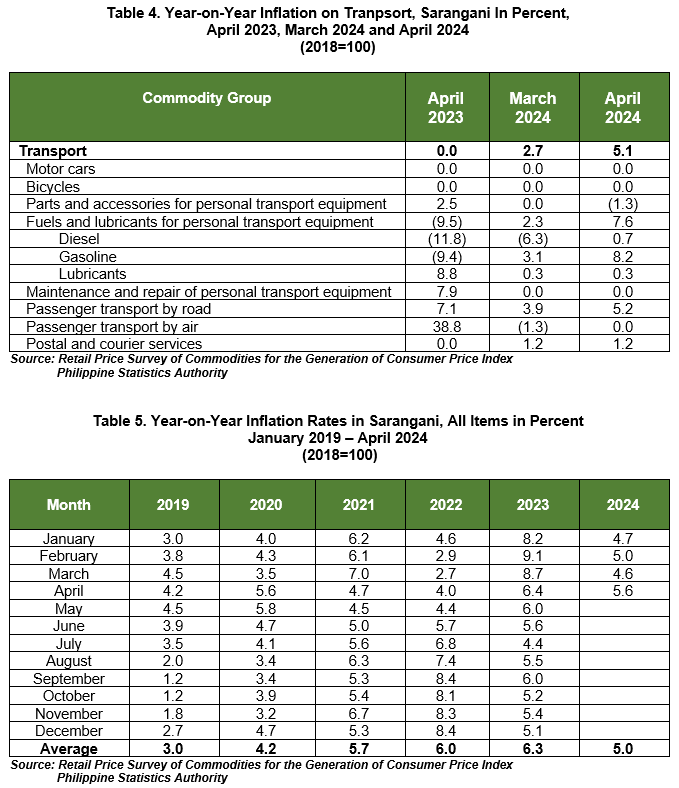
The inflation for transport, continued to move upward at 5.1 percent in April 2024 from 2.7 percent in March 2024. This was primarily due to the higher annual growth of gasoline at 8.2 percent from 3.1 percent; passenger transport by road at 5.2 percent from 3.9 percent; diesel, at 0.7 percent from -6.3 percent and, passenger transport by air at 0.0 percent from -1.3 percent in March 2024. (Table 4)
| Attachment | Size |
|---|---|
|
|
344.01 KB |