

Release Date :
Reference Number :
25R1280-SR-043
A. General Santos City
1. Overall Inflation
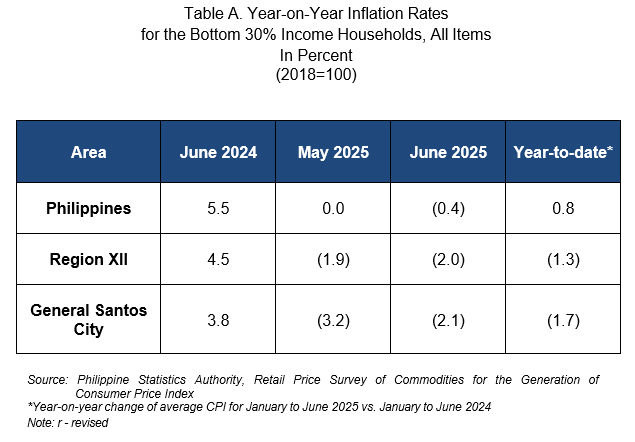
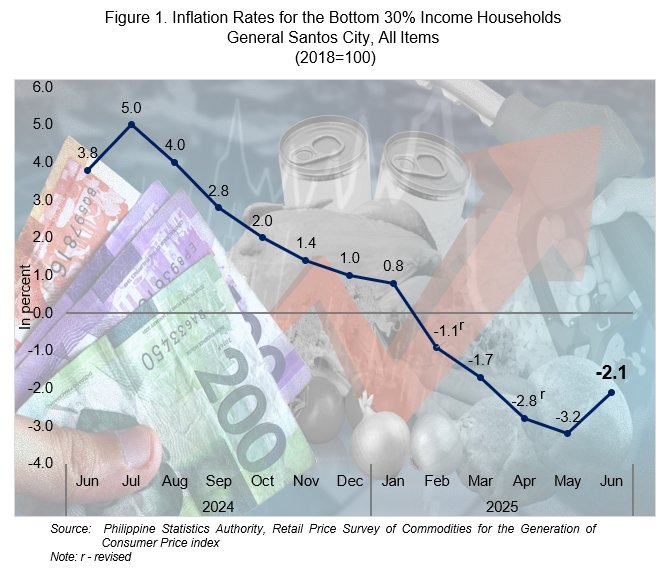
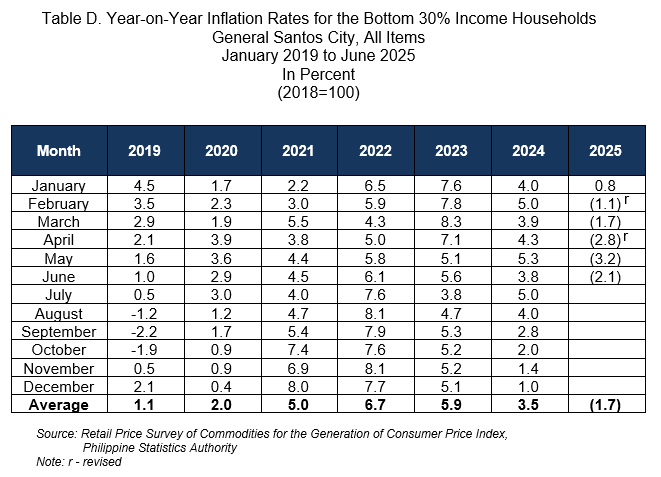
The overall inflation rate for the bottom 30% income households in General Santos City recorded a slower annual decrease at 2.1 percent in June 2025 from an annual drop at 3.2 percent in May 2025. In June 2024, the city’s inflation rate was higher at 3.8 percent. (Figure 1 and Table A)
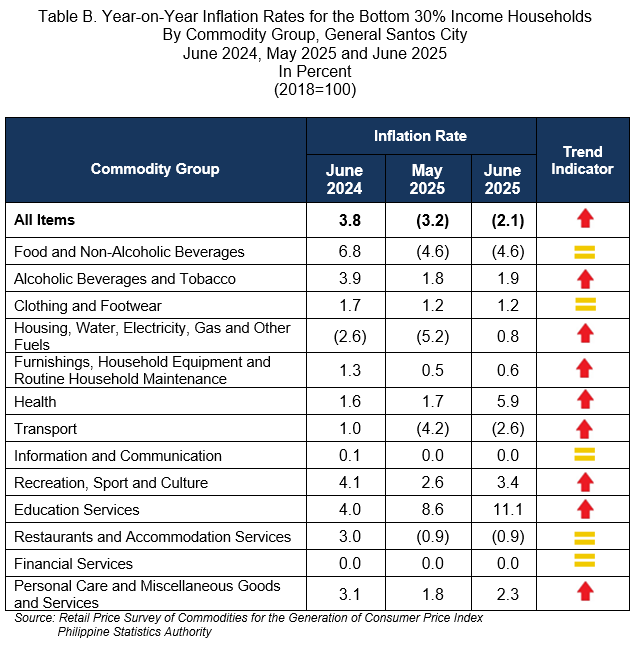
1.1 Main Drivers to the Upward Trend of the Overall Inflation (Table B)
The uptrend in General Santos City’s inflation for the bottom 30% income households was primarily brought about by the year-on-year incline in housing, water, electricity, gas and other fuels at 0.8 percent in June 2025 from an annual decrease at 5.2 percent in May 2025. This was followed by the slower annual decrement in the index of transport at 2.6 percent in June 2025 from a 4.2 percent annual decline in the previous month. Health also contributed to the uptrend with a faster annual increase at 5.9 percent during the month from1.7 percent in May 2025.
Moreover, faster inflation rates were observed in the following indices for the bottom 30% income households in June 2025:
a) Alcoholic beverages and tobacco, 1.9 percent from 1.8 percent;
b) Furnishings, household equipment and routine household maintenance, 0.6 percent from 0.5 percent;
c) Recreation, sport and culture, 3.4 percent from 2.6 percent;
d) Education services, 11.1 percent from 8.6 percent; and
e) Personal care and miscellaneous goods and services, 2.3 percent from 1.8 percent.
Meanwhile, the rest of the commodity groups maintained their respective previous month’s inflation rates as follows:
a) Food and non-alcoholic beverages, at -4.6 percent;
b) Clothing and footwear, at 1.2 percent;
c) Information and communication, at zero inflation;
d) Restaurants and accommodation services, at -0.9 percent; and
e) Financial Services, at zero inflation.
1.2 Main Contributors to the Overall Inflation
The top three commodity groups which contributed to the overall inflation in June 2025 for the bottom 30% income households were the following:
a. Food and non-alcoholic beverages with 112.6 percent share or -2.4 percentage point; and
b. Transport with 12.2 percent share or -0.3 percentage point; and
c. Restaurants and accommodation services with 3.2 percent share or -0.1 percentage point.
2. Food Inflation
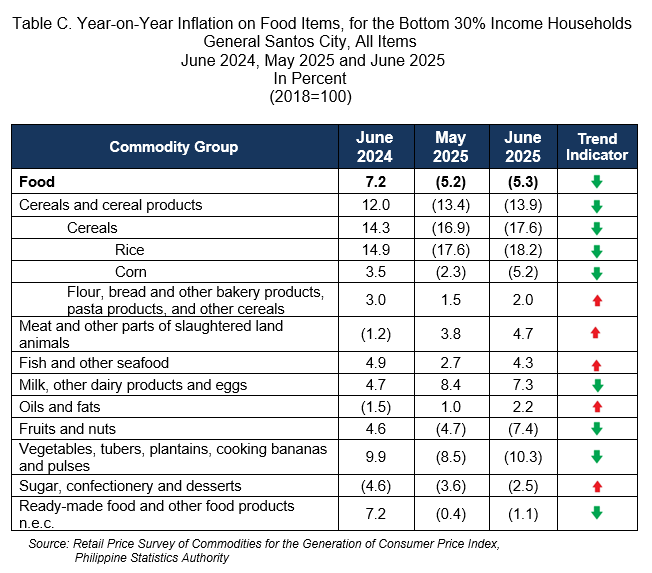
Food inflation for the bottom 30% income households in General Santos City posted a faster annual decline at 5.3 percent in June 2025 from a 5.2 percent annual drop in the previous month. In June 2024, the city’s food inflation was higher at 7.2 percent.
2.1 Main Drivers to the Downward Trend of Food Inflation (Table C)
The deceleration of food inflation for the bottom 30% income households in June 2025 was mainly due to faster year-on-year decrease in the index of rice at 18.2 percent from a 17.6 percent annual drop in May 2025. This was followed by the faster annual decrement in the index of vegetables, tubers, plantains, cooking bananas and pulses at 10.3 percent during the month from a 8.5 percent annual decline in May 2025. Also, contributed to the downtrend was the lower inflation rate in the index of milk, other dairy products and eggs at 7.3 percent in June 2025 from 8.4 percent in the previous month.
In addition, faster annual decrements were observed in the following indices for this particular income group during the month:
a) Corn, -5.2 percent from -2.3 percent;
b) Fruits and nuts, -7.4 percent from -4.7 percent; and
c) Ready-made food and other food products n.e.c., -1.1 percent from -0.4 percent.
In contrast, higher inflation rates were recorded in the following food groups for the bottom 30% income households in June 2025:
a) Flour, bread and other bakery products, pasta products, and other cereals, 2.0 percent from 1.5 percent;
b) Meat and other parts of slaughtered land animals, 4.7 percent from 3.8 percent;
c) Fish and other seafoods, 4.3 percent from 2.7 percent; and
d) Oils and fats, 2.2 percent from 1.0 percent.
Moreover, slower annual decline was observed in the index of sugar, confectionery and desserts at 2.5 percent in June 2025 from a 3.6 percent annual drop in the previous month.
2.2 Main Contributors to the Food Inflation
Food inflation share was at 120.9 percent or -2.5 percentage point to the June 2025 overall inflation for this particular income group.
The top three food groups in terms of contribution to food inflation during the month were the following:
a. Cereals and cereal products which includes rice, corn, flour, bread and other bakery products, pasta products, and other cereals with 114.5 percent share or -6.1 percentage point;
b. Vegetables, tubers, plantains, cooking bananas and pulses with 15.2 percent share or -0.8 percentage point; and
c. Fruits and nuts with 4.4 percent share or -0.2 percentage point.

| Attachment | Size |
|---|---|
|
|
477.51 KB |