Total external trade went up by 9.3 percent
The SOCCSKSARGEN Region's external trade in products in December 2023 increased by 9.3 percent to US$204.804 million from US$187.363 million in December 2022. (Table 1).
The trade balance increased by 47.8 percent
Balance of trade in goods (BoT-G) is the difference between the value of exports and imports. The BoT-G amounted to US$42.634 million in December 2023, increased by 47.8 percent from US$28.845 million recorded in December 2022 (Table 1).
Merchandise Trade
The export value increased by 14.4 percent to US$123.719 million in December 2023 from US$108.104 million in December 2022. The volume of exports totaled to 118.708 million kilograms in December 2023 from 91.238 million kilograms the previous year. The value of imports went up by 2.3 percent to US$81.085 million in December 2023 from US$79.259 million in December 2022. Imports volume was summed up to 168.476 million kilograms in December 2023 from 104.263 million kilograms in December 2022.

Unblended Petroleum Oils was the top import commodity
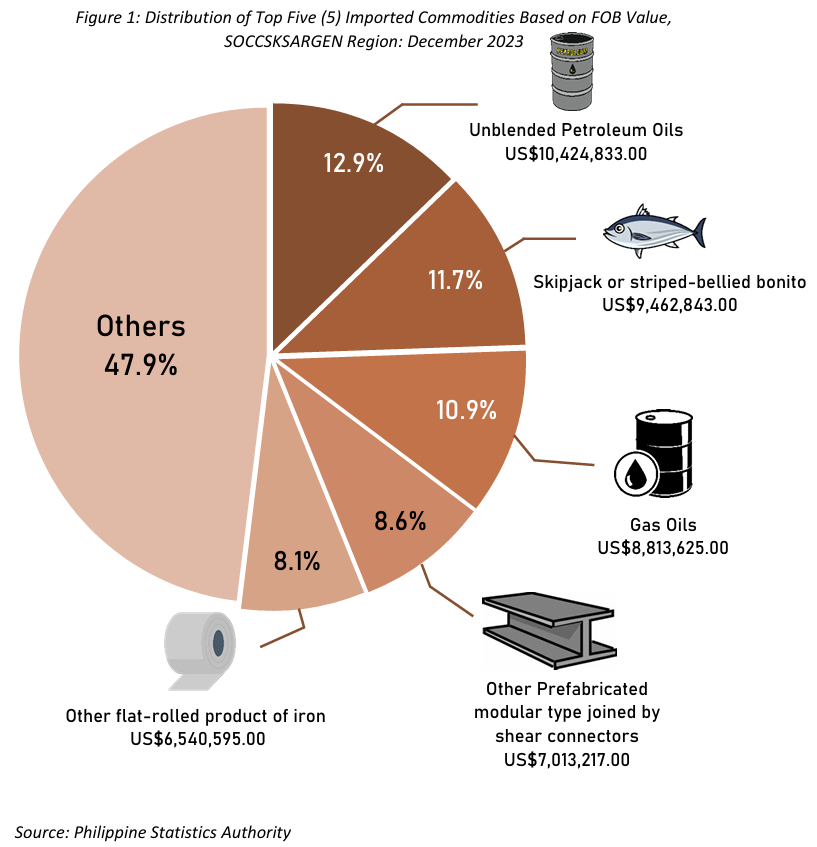
The top import commodity was Unblended Petroleum Oils at US$10.425 million accounting for 12.9 percent of the region’s overall import value. Followed by Skipjack or stripes-bellied bonito at US$9.463 million (11.7%), Gas Oils at US$8.814 million (10.9%), Other Prefabricated modular type joined by shear connectors at US$7.013 million (8.6%), and Other flat-rolled products of iron, plated or coated with tin, of a thickness of less than 0.5 mm with US$6.541 million (8.1%). (Figure 1)

China was the largest source of imported goods
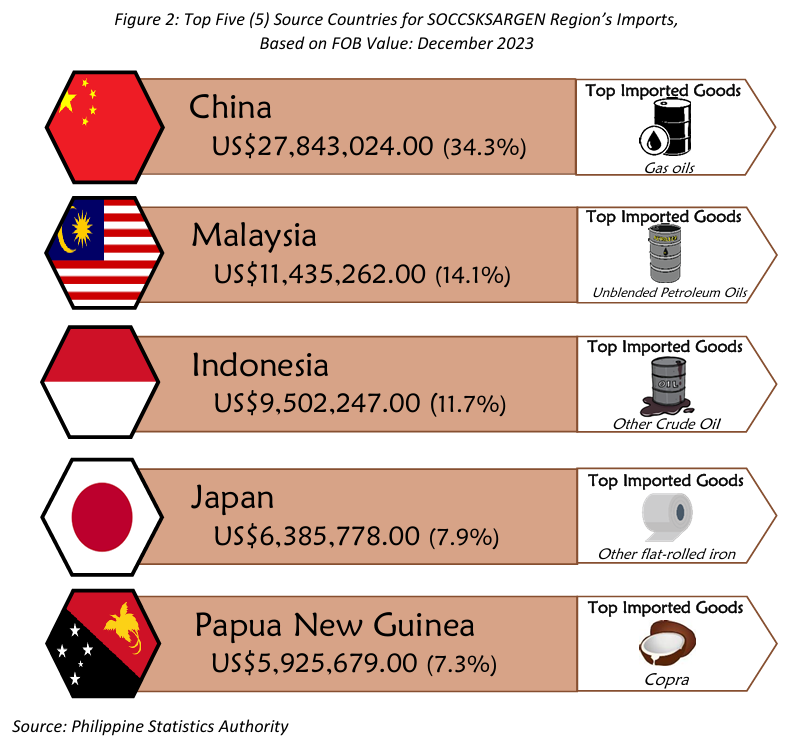
China was the region's largest importer with US$27.843 million accounting for 34.3 percent of total imports. It was followed by Malaysia with US$11.435 million (14.1%), Indonesia with US$9.502 million (11.7%), Japan with US$6.386 million (7.9%), and Papua New Guinea with US$5.926 million (7.3%).
The leading imports in China was Gas Oils; Unblended Petroleum Oils in Malaysia; Other Crude Oils in Indonesia; Other flat-rolled iron, plated or coated with tin, of a thickness of less than 0.5 mm in Japan and Copra in Papua New Guinea. (Figure 2)

Tunas in airtight containers were the top export goods
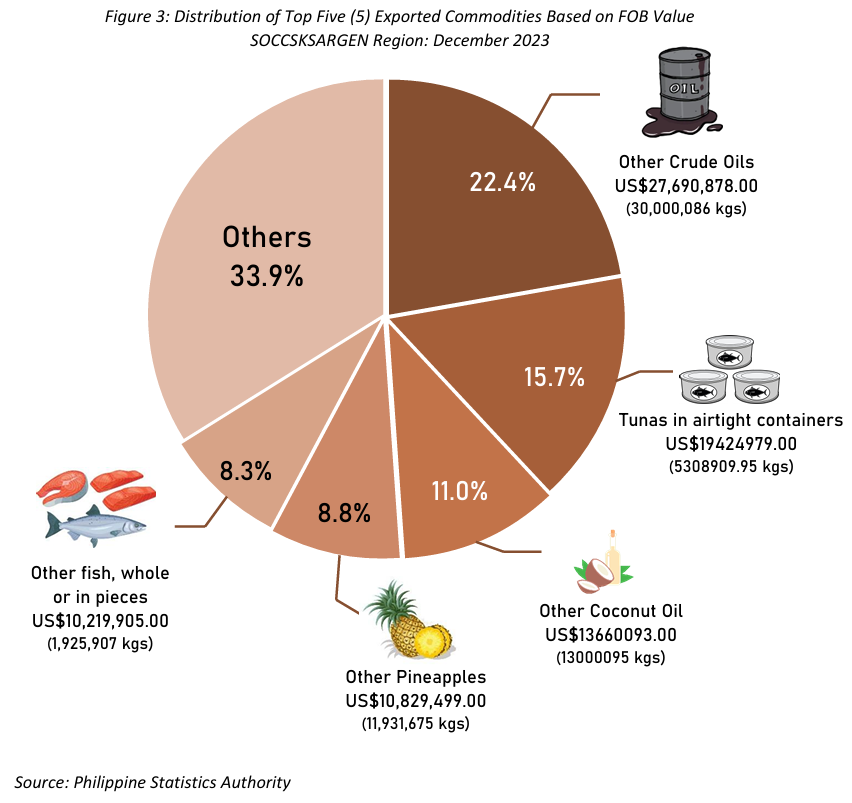
Tunas in airtight containers, Other Pineapples, Other fish, whole or in pieces, Other Crude Oils, and Fresh Pineapples were the top five export goods in terms of FOB Value. Tunas in airtight containers were valued at US$15.451 million (17.4%); Other Pineapples at US$10.063 million (11.3%); Other fish, whole or in pieces at US$9.195 million (10.4%); Other Crude Oils at US$8.659 million (9.7%); and Fresh Pineapples at US$7.843 million (8.8%). (Figure 3)

The United States of America was the top export commodity destination
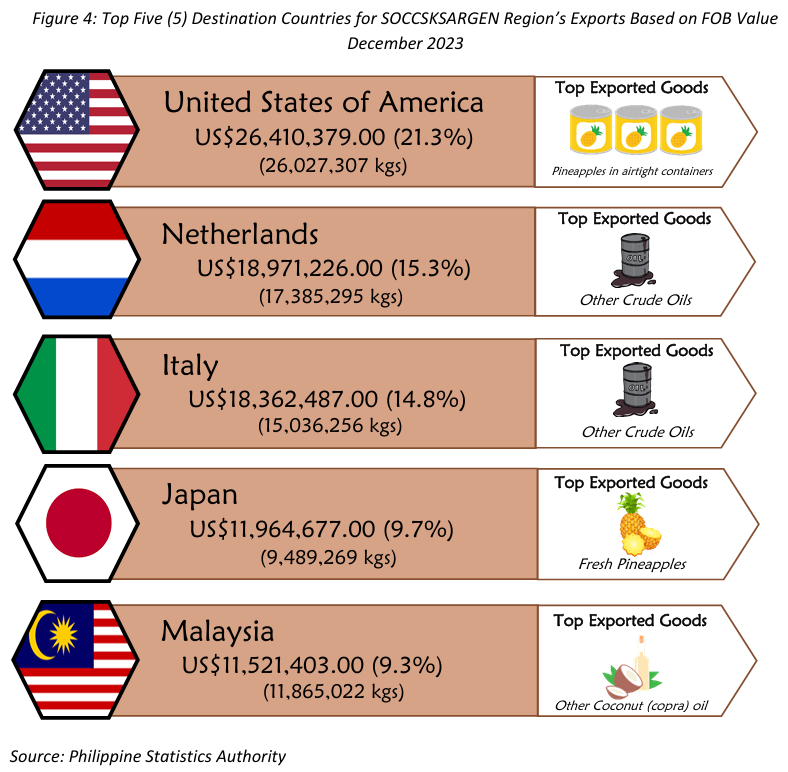
The region's top export market was the United States of America with US$26.410 million accounting for 21.3 percent of the total export value. Following it was the Netherlands with US$18.971 million (15.3%), Italy with US$18.362 million (14.8%), Japan with US$11.965 million (7.1%), and Malaysia with US$11.521 million (9.3%).
The top export in the United States of America was Pineapples in airtight containers. Other Crude Oil in Netherlands and Italy, Fresh Pineapples in Japan, and Other coconut (copra) Oil in Malaysia. (Figure 4).

Approved for Release:
SGD
ATTY. MAQTAHAR L. MANULON, CESO V
Regional Director
For inquiries, please contact:
SITTIMAZUIN M. HOFILEÑA/NORJAHNA M. HADJINOR-DISCAYA
Statistical Operations and Coordination Division, PSA-RSSO XII
Telephone Number (083) 825-2830

