Total external trade up by 9.9 percent
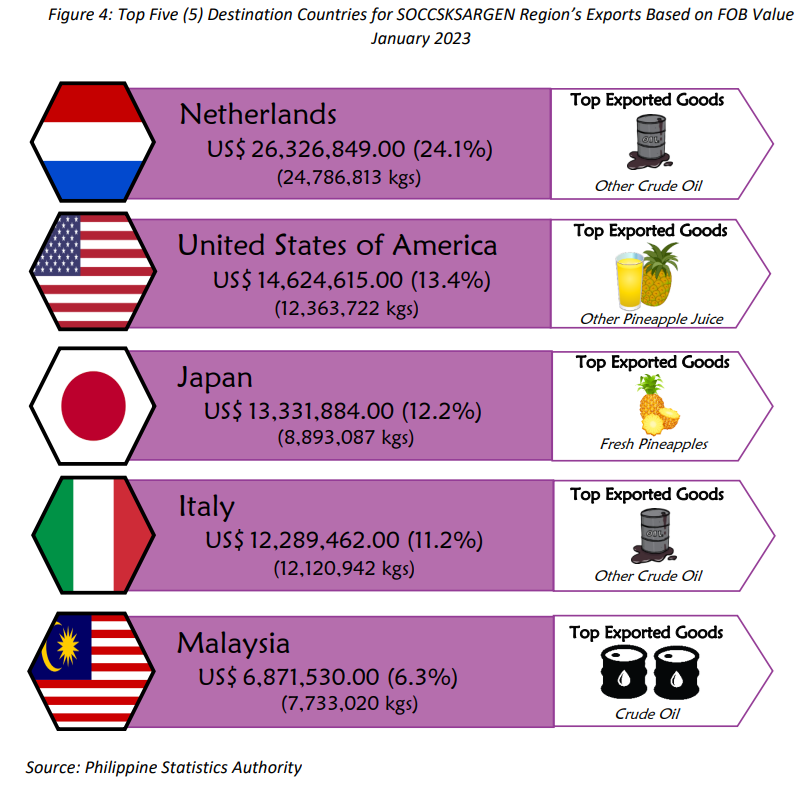
The SOCCSKSARGEN Region's external trade in products in January 2023 increased by 9.9 percent at US$194.516 million from US$177.044 million in January 2022. (Table 1).
Trade balance increased by 21.9 percent
Balance of trade in goods (BoT-G) is the difference between the value of exports and imports. The BoT-G amounted to US$121.848 million in January 2023, an increase of 21.9 percent from US$99.944 million recorded in January 2022 (Table 1).
Merchandise Trade
The total export value increased by 24.3 percent to US$109.250 million in January 2023 from US$87.893 million in January 2022. The volume of exports summed up to 102.542 million kilograms in January 2023 from 78.120 million kilograms the previous year. The value of imports were down by 4.4 percent to US$85.266 million in January 2023 from US$89.152 million in January 2022. Imports volume were up to 224.390 million kilograms in January 2023 from 178.064 million kilograms in January 2022.
Gas Oils was the top import commodity
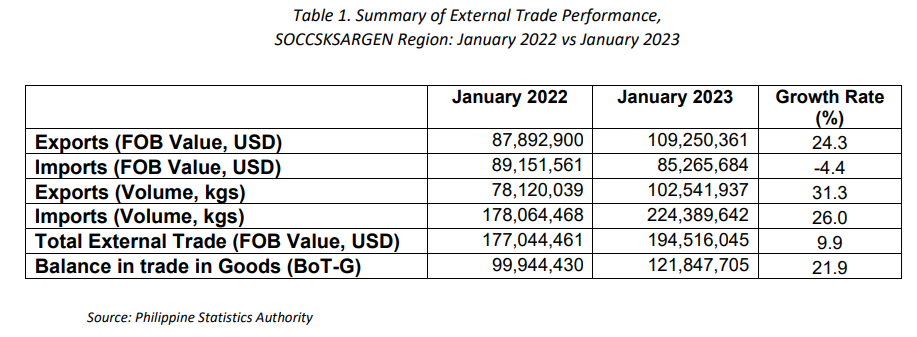
The top import commodity of the region was Gas Oils at US$22.475 million accounting for 31.4 percent of the region’s overall import value. Followed by Unblended Petroleum Oils at US$11.061 million (15.4%), Skipjack or stripe-bellied bonito with US$6.166 million (8.6%), Other flat-rolled products of iron, plated or coated with tin, of a thickness of less than 0.5 mm with US$4.949 million (6.9%), and Other Petroleum Oils with US$2.481 million (3.5%). (Figure 1)
Malaysia was the largest source of import goods
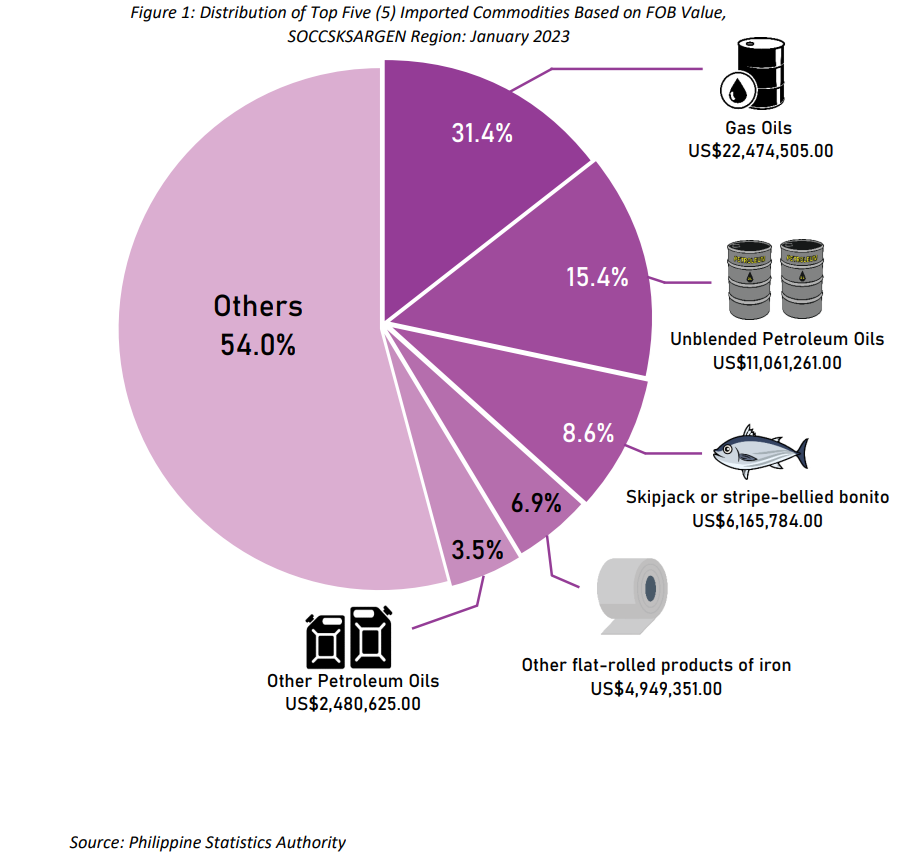
Malaysia was the region's largest importer with US$14.975 million accounting for 17.6 percent of total imports of the region. Followed by Papua New Guinea with US$12.569 million (14.7%), South Korea with US$12.293 million (14.4%), Indonesia with US$10.188 million (11.9%), and China with US$8.509 million (10.0%).
Unblended Petroleum Oils was the leading imports from Malaysia; Skipjack or striped-bellied bonito in Papua New Guinea; Gas Oils in South Korea; Other Coals in Indonesia; and Pacific Mackerel in China. (Figure 2)
Other Crude Oils were the top export goods
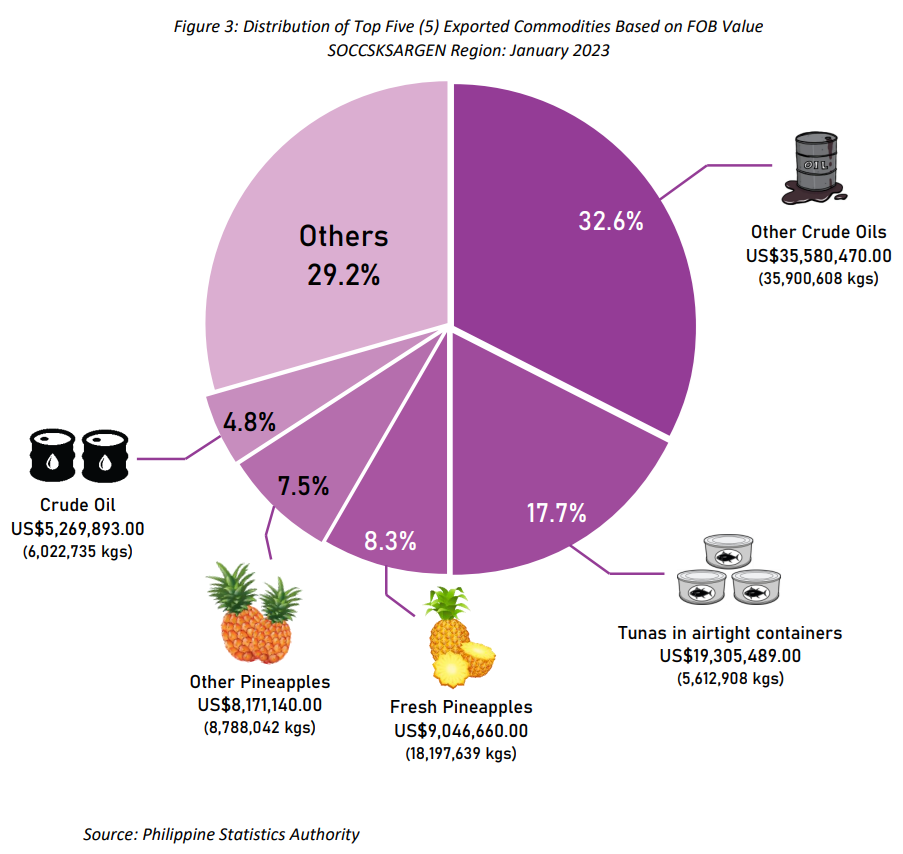
Other Crude Oils, Tunas in airtight containers, Fresh Pineapple juice, Fresh Other Pineapples, and Crude Oils, and were the top five export goods in terms of FOB Value. Other Crude Oils were valued at US$35.580 million (32.6%), Tunas in airtight containers, US$19.305 million (17.7%); Fresh Pineapples at US$9.047 million (8.3%); Other Pineapples at US$8.171 million (7.5%); and Crude Oil, US$5.270 million (4.8%). (Figure 3)
Netherlands was the top export commodity destination
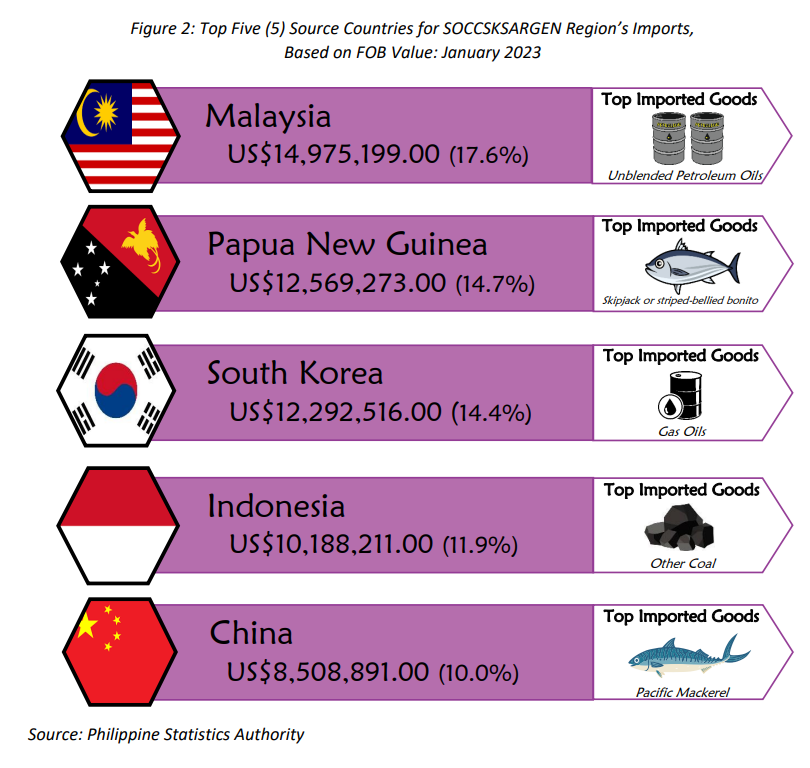
Netherlands were the region's top export market with US$26.327 million accounting for 24.1 percent of the total export value. Following it was the United States of America with US$14.625 million (13.4%), Japan with US$13.332 million (12.2%), Italy with US$12.289 million (11.2%), and Malaysia with US$6.872 million (6.3%).
Other Crude Oil was the top exports in Netherlands and Italy, Other Pineapple Juice in United States of America, Fresh Pineapples in Japan, and Crude Oils in Malaysia. (Figure 4).
